Join Our Telegram channel to stay up to date on breaking news coverage
Bitcoin (BTC) Price Prediction – September 1
Bitcoin (BTC) is currently moving above the $12,000 level for the first time in almost two weeks.
BTC/USD Long-term Trend: Bullish (Daily Chart)
Key levels:
Resistance Levels: $12,700, $12,900, $13,100
Support Levels: $11,100, $10,900, $10,700
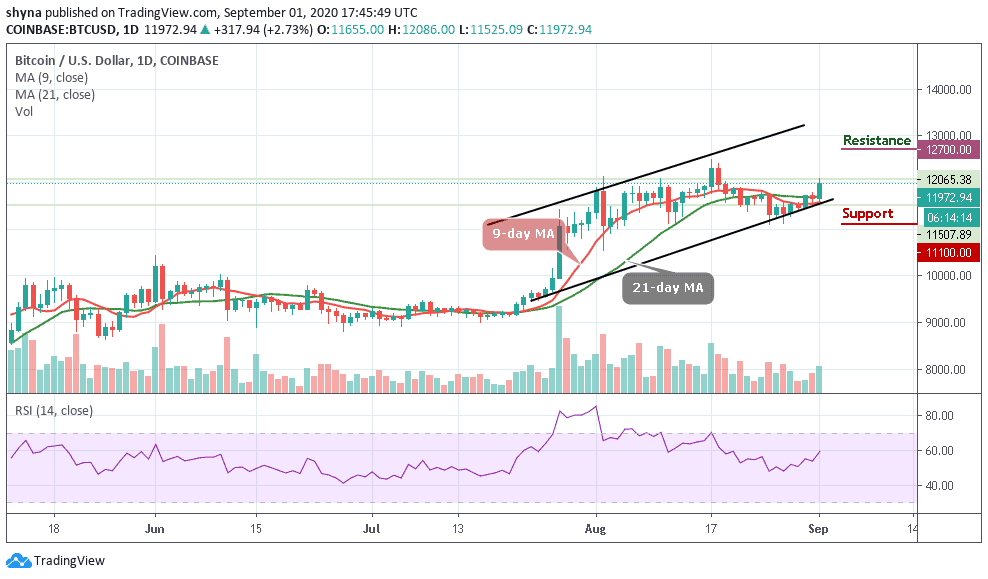
BTC/USD is now back on the path towards $12,000 after being rejected at this threshold two weeks ago. Bitcoin (BTC) is currently trading at around $11,972.94 but touched a peak of $12,086 earlier today. More so, the Bitcoin price seems to be not in the mood of showing a strong price increase. At the time of writing, the coin is trading above the 9-day and 21-day moving averages with the gains of 2.73%.
Where is the Bitcoin Price Going Next?
Now, it is necessary to bear in mind that Bitcoin is growing bullishly this year and looks very good in the medium to long term. However, we can only find another bull run if the Bitcoin price manages to break the important resistances. The thing with BTC/USD price is that it was able to break the $12,000 mark twice but both the times it declined after displaying the bullish momentum.
Therefore, as the technical indicator RSI (14) moves to cross above 60-level, the Bitcoin price must crack the $12,000 mark and need to stay above $12,000 consistently so that it can touch the golden resistance levels at $12,700, $12,900, and $13,100. Nevertheless, any bearish movement below the moving averages may likely bring back the Bitcoin price to the supports at $11,100, 10,900, and $10,700 respectively.
BTC/USD Medium – Term Trend: Bullish (4H Chart)
On the 4-hour chart, a retest of $11,809 gives the impression that the bulls are not yet done. The Bitcoin price rises to fill a significant gap as the bulls remained in control which may take the coin towards the $12,100. In a short time, BTC/USD may hit $12,200 if the bullish pressure continues. Otherwise, the price may revisit the supports of $11,800 and below.
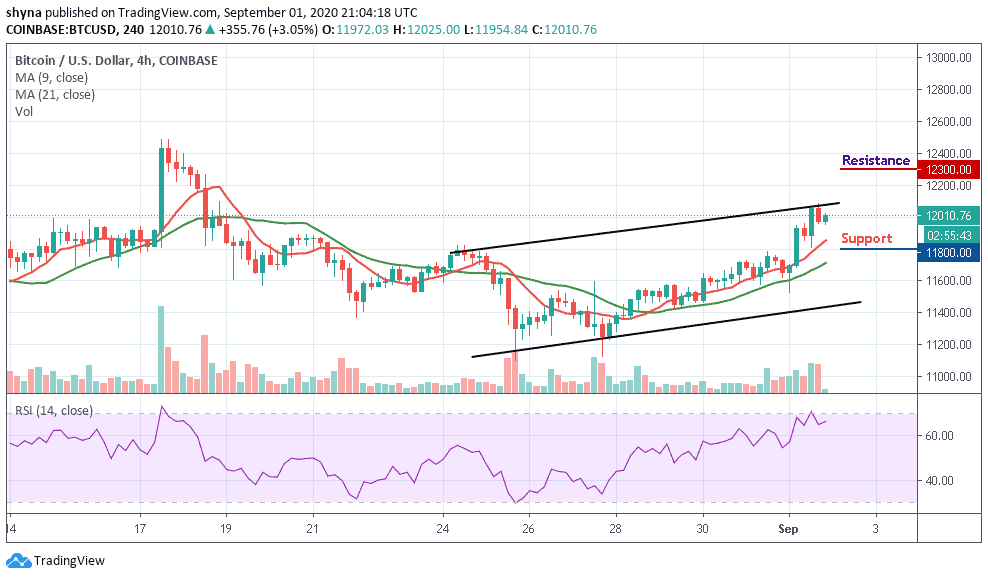
On the upside, a bullish move may continue to meet resistance at around $12,300 and above. As of now, the 4-hours RSI (14) is moving above 65-level, this could mean that the BTC/USD trading is looking for another close resistance. Meanwhile, a significant cross below the moving averages may send the market in a bearish scenario.
Join Our Telegram channel to stay up to date on breaking news coverage