Join Our Telegram channel to stay up to date on breaking news coverage
According to popular YouTuber Steve from Crypto Crew University, Bitcoin is poised for a significant price swing according to a powerful signal that only occurs once a year. In his latest video, he highlights the importance of this signal and its potential impact on the market.
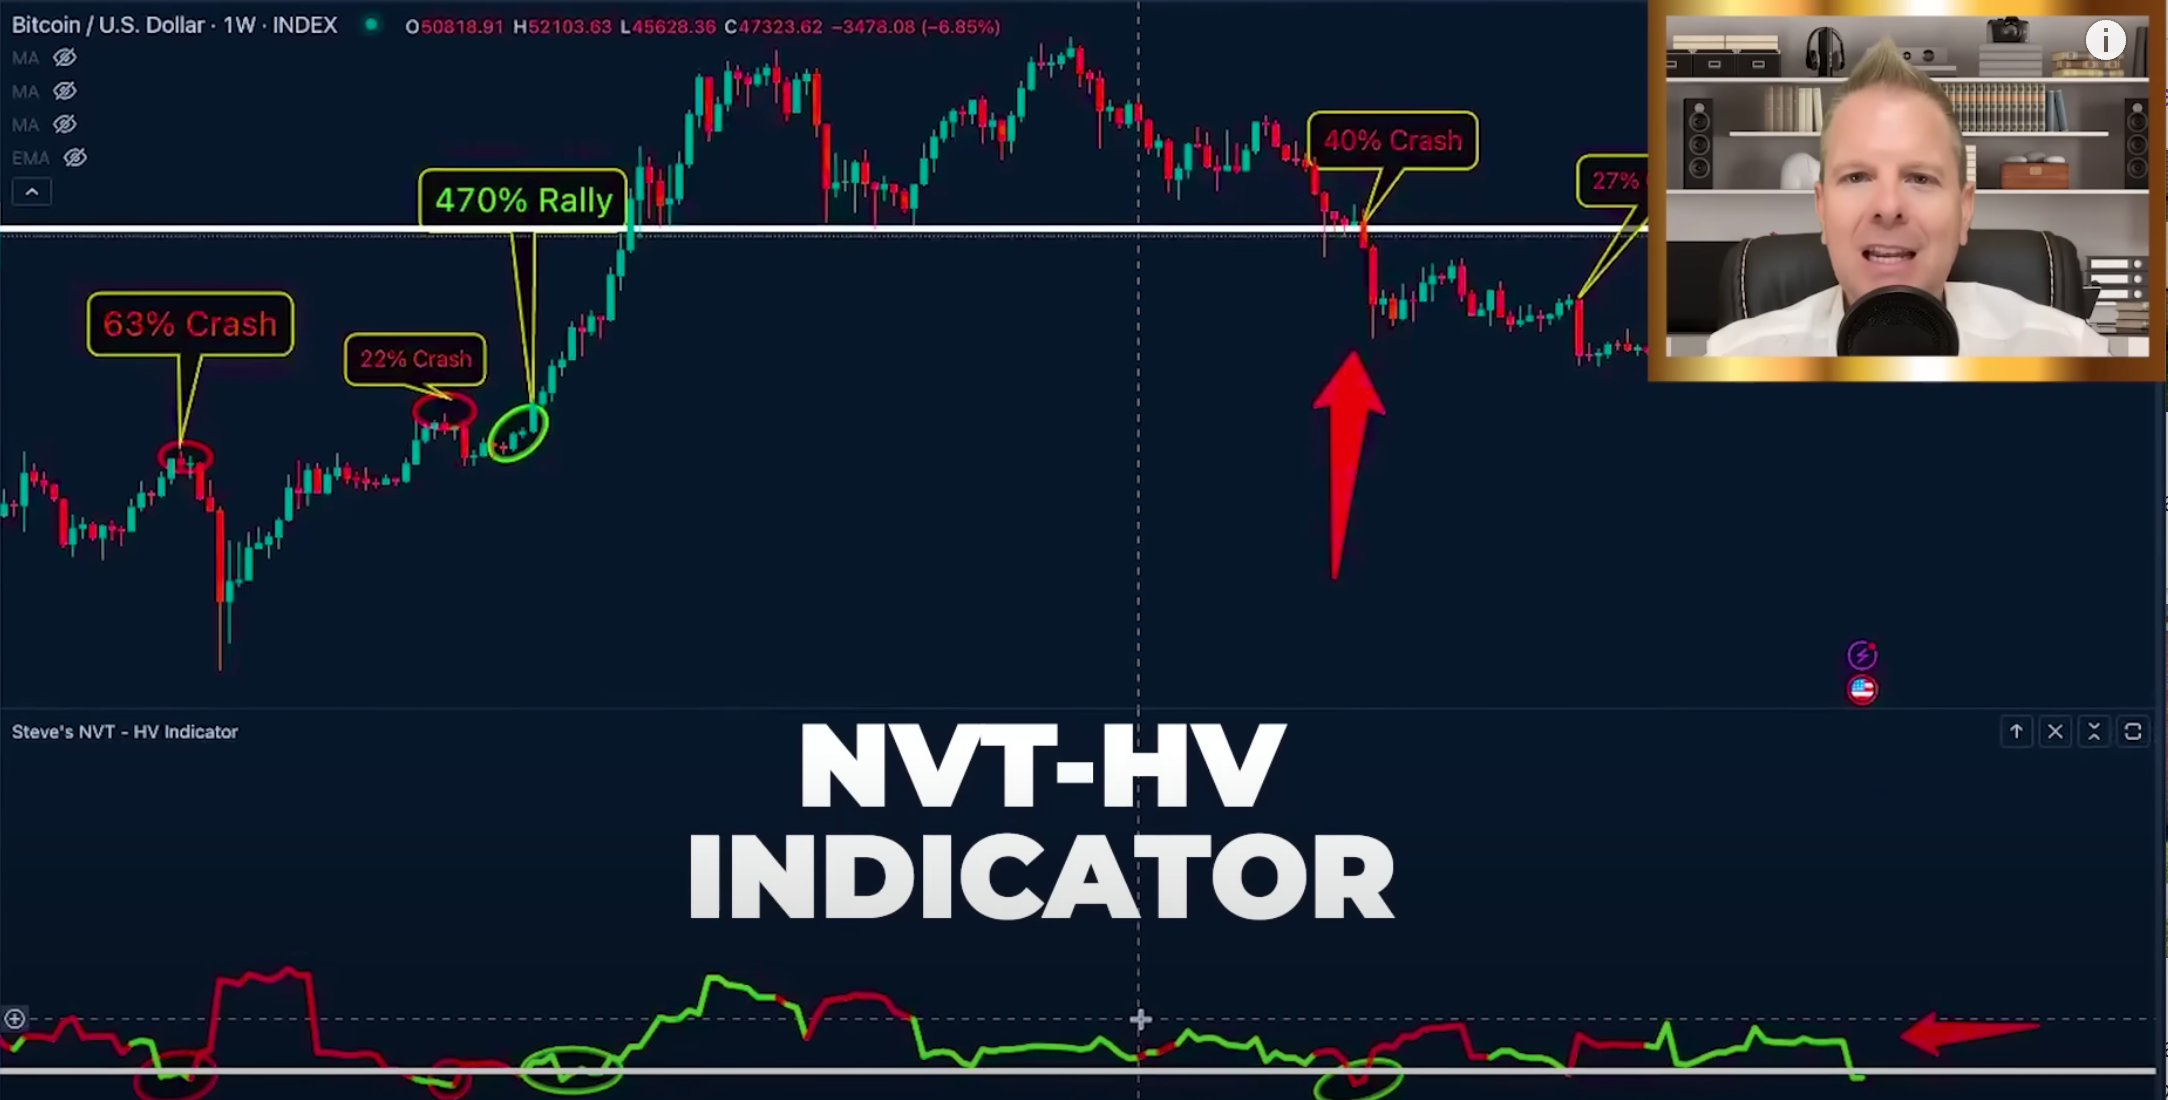
The signal Steve focuses on is generated by a custom indicator called the NVT-HV indicator, which combines two metrics: the NVT (Network Value to Transactions ratio) and the HV (Historical Volatility). By changing the indicator’s settings to display red and green colors, Steve demonstrates its effectiveness in predicting major moves in Bitcoin’s price.
According to Steve, when the historical volatility drops below the 40 level for Bitcoin, it indicates that a significant move is on the horizon. He cites a past instance when a 470% price increase occurred precisely when the volatility reached this level. This pattern has also coincided with major crashes in the past, such as the 63% and 40% crashes, signifying a shift in market momentum.
The indicator uses green to represent a potential price increase and red to indicate a potential price decrease. When the indicator’s color drops below the volatility level, it suggests that Bitcoin is setting up for its largest move of the year. Steve compares this phenomenon to the calm before a storm, explaining that low volatility signifies a lack of buying or selling activity and foreshadows an impending market shift.
To further illustrate the indicator’s accuracy, Steve offers a simple buy and sell strategy. When the color changes to red, it suggests selling, while a change to green indicates buying. By following this strategy, one could have sold Bitcoin at its peak and bought during significant dips, resulting in substantial profits.
A Key Resistance Level at $29,000
Steve directs viewers’ attention to a particular white line on the chart, which represents a key resistance level at around $29,000. He notes that Bitcoin has struggled to hold this level as support throughout the year. Crossing and maintaining support above this level would invalidate the bearish argument and confirm the start of a bullish phase.
While Steve acknowledges the possibility of anomalous outcomes, he emphasizes the importance of assessing probabilities rather than talking in certainties. Based on the available facts, he believes it is highly probable that Bitcoin is currently in phase one of a bull market. However, he considers it unlikely that Bitcoin will surpass $50,000 this year, given the existing market conditions.
In conclusion, Steve advises viewers to pay attention to the color changes in the indicator and the volatility level, as they indicate the calm before a potential storm in Bitcoin’s price.
Related
- Famous Trader Talks About a Major Bitcoin Signal Nobody Has Noticed Yet
- 20 Best Crypto Youtube Channels to Follow & Subscribe to
- Best Web3 Projects
- VC Firm Going Beyond Crypto Into A.I.
Best Wallet - Diversify Your Crypto Portfolio
- Easy to Use, Feature-Driven Crypto Wallet
- Get Early Access to Upcoming Token ICOs
- Multi-Chain, Multi-Wallet, Non-Custodial
- Now On App Store, Google Play
- Stake To Earn Native Token $BEST
- 250,000+ Monthly Active Users
Join Our Telegram channel to stay up to date on breaking news coverage


