Join Our Telegram channel to stay up to date on breaking news coverage
The Binance Coin price prediction is currently facing a serious decline in value of 1.40% after being rejected at a $279 resistance level.
Binance Coin Prediction Statistics Data:
- Binance Coin price now – $274.4
- Binance Coin market cap – $44.3 billion
- Binance Coin circulating supply – 161.3 million
- Binance Coin total supply – 161.3 million
- Binance Coin Coinmarketcap ranking – #5
BNB/USD Market
Key Levels:
Resistance levels: $310, $320, $330
Support levels: $250, $240, $230
Your capital is at risk
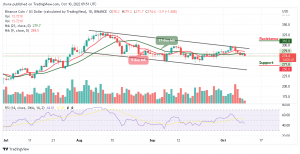
BNB/USD is now moving towards the south as the price failed to break above the 9-day and 21-day moving averages. Looking at the daily chart, Binance Coin (BNB) shows that the price is still moving within the channel, though the price may need to retreat a little bit before heading to the upside.
Binance Coin Price Prediction: Binance Coin Price May Break into the Downside
The Binance Coin price remains below the 9-day and 21-day moving averages, therefore, should buyers manage to power the market; they may likely find resistance levels of $310, $320, and $330. Nevertheless, bulls need to hold the current level of $274 to begin an upward movement.
On the contrary, if the market experience more drops, it could hit the nearest support at $260 and a further drop below the lower boundary of the channel could pull the market to the support levels of $250, $240, and $230 respectively. Therefore, the technical indicator Relative Strength Index (14) is crossing below the 50-level, indicating more bearish signals in the nearest term.
Looking at the daily chart, BNB/BTC is moving to the downside as the price remains below the 9-day and 21-day moving averages. Moreover, Binance Coin bears are likely to drag the price towards the lower boundary of the channel, any further bearish movement could take the coin to the support level of 1350 SAT and below.
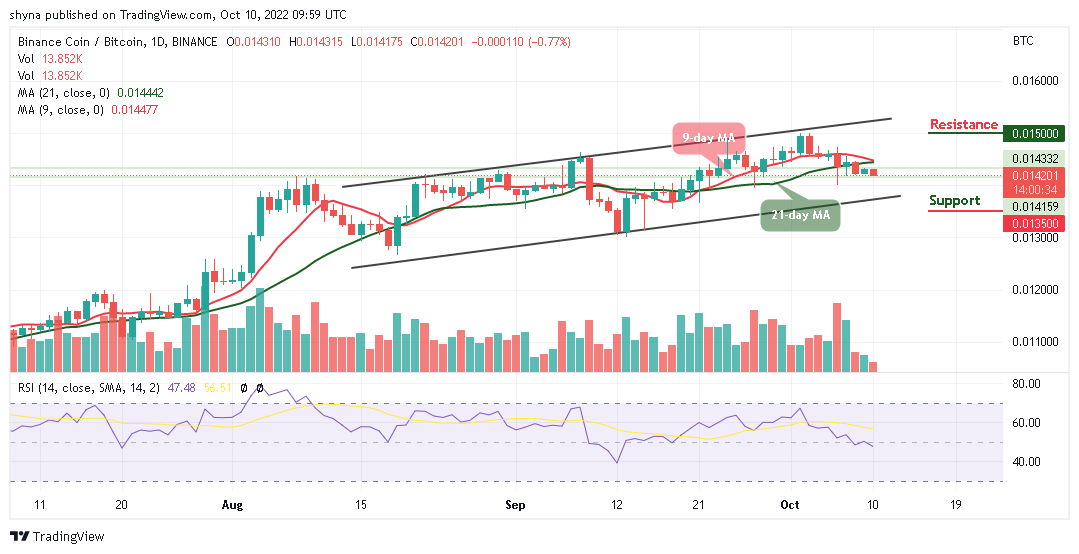
Looking at the technical indicator, the Relative Strength Index (14) appears that bears could put pressure on the bulls as the signal crosses below the 50-level. In other words, if the bulls can regroup and halt the downward movement, the Binance Coin price may begin an uptrend and cross above the moving averages to reach the resistance level of 1500 SAT and above.
Join Our Telegram channel to stay up to date on breaking news coverage