Join Our Telegram channel to stay up to date on breaking news coverage
Binance Coin Price Prediction – June 20
The Binance Coin may push for recovery up to the $250 resistance line or thereabout as the market needs to make a necessary rallying motion within well-defined trading zones. Price is trading around $215 as of the time of writing at an average of a minimal 0.19% positive. The return on investment about five years ago is at 224,172.25 percent.
Binance Coin Price Statistics:
BNB price now – $215.21
BNB market cap – $35.2 billion
BNB circulating supply – 163.3 million
BNB total supply – 163.3 million
Coinmarketcap ranking – #5
Binance Coin Market
Key Levels:
Resistance levels: $260, $290, $320
Support levels: $200, $180, $160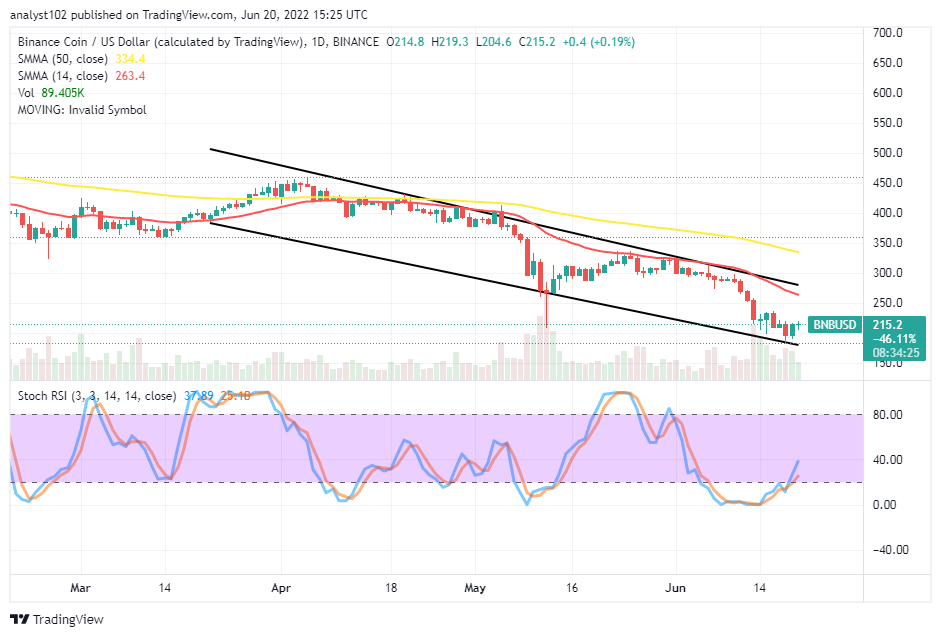 BNB /USD – Daily Chart
The BNB/USD daily chart reveals the crypto market may push to a $250 resistance level or at a bit higher-moving rate to the point given by the smaller SMA trend line around $263. The 50-day SMA indicator is over the 14-day SMA indicator. Variant candlesticks have featured in succession to the downside nearing the lower bearish channel trend line. The Stochastic Oscillators have somewhat slantingly traveled southbound from the oversold region to reach the 40 range. And they still point toward the north side.
Will the BNB/USD market bears to push back soon against the lower bearish trend line?
It may be too early to expect the BNB/USD market bears to push the price back against the lower bearish trend line as a continuation of the downward-trending outlook of the crypto economy. Nevertheless, it has been indicated by the formation of a bullish candlestick that the market may push minimally to the $250 level if bulls have to count on the upward-springing force that the bullish candlestick will have to produce in the process.
On the downside of the technical analysis, going by the current downward-trending force pace, the BNB/USD market bears may have to suspend the launching of new selling position orders for a while. The reading of the Stochastic Oscillators, attempting to cross southbound at a high-range line, will suggest a safer selling entry point afterward, especially between $263 and $334 areas of resistance trading.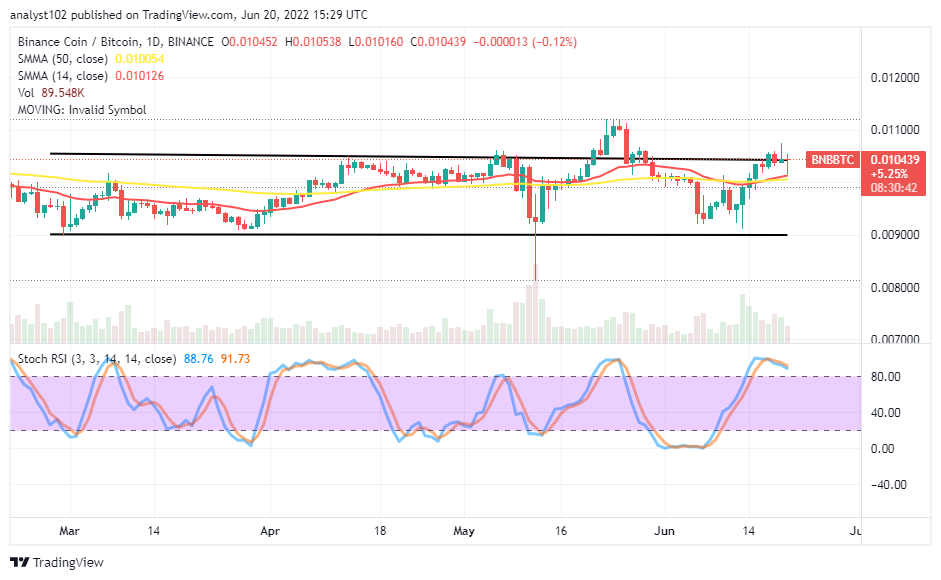
BNB/BTC Price Analysis
In comparison, Binance Coin appears to have pushed against the trending force of Bitcoin up to a notable peak point that it might be experiencing pit stops for some time. The cryptocurrency pair market may push up slightly for a little high above the upper range line drawn. The 14-day SMA trading indicator has conjoined with the 50-day SMA indicator within the range channels. The Stochastic Oscillators are in the overbought region, with their lines conjoined briefly facing the southbound direction. That signifies a warning signal that the base crypto may soon begin to downsize against the flagship counter crypto.
Looking to buy or trade Binance Coin (BNB) now? In-Content Heroes link!
68% of retail investor accounts lose money when trading CFDs with this provider.
Read more:
- How to buy Binance Coin
- How to buy cryptocurrency
Join Our Telegram channel to stay up to date on breaking news coverage
