Join Our Telegram channel to stay up to date on breaking news coverage
BNBUSD Price Analysis – August 09
In case the Buyers were able to push the price above the supply level of $30 and the daily candlestick close above the level, then, the price may rally towards the previous high, supply level of $41.
GBP/JPY Market
Key levels:
Supply levels: $30, $35, $41
Demand levels: $25, $20, $13
BNBUSD Long-term trend: Bullish
BNBUSD is bullish on the long-term outlook. The coin reached a high of $41 supply level on June 22. The resistance at the level prevented further increase in price and the price dropped to the low of $25 demand level after penetrating the barriers at $35, $30 price level. The Bears defended the demand level of $25. The price bounced to retest the supply level of $30. Then, it started moving sideways within the supply level of $30 and the demand level of $25.
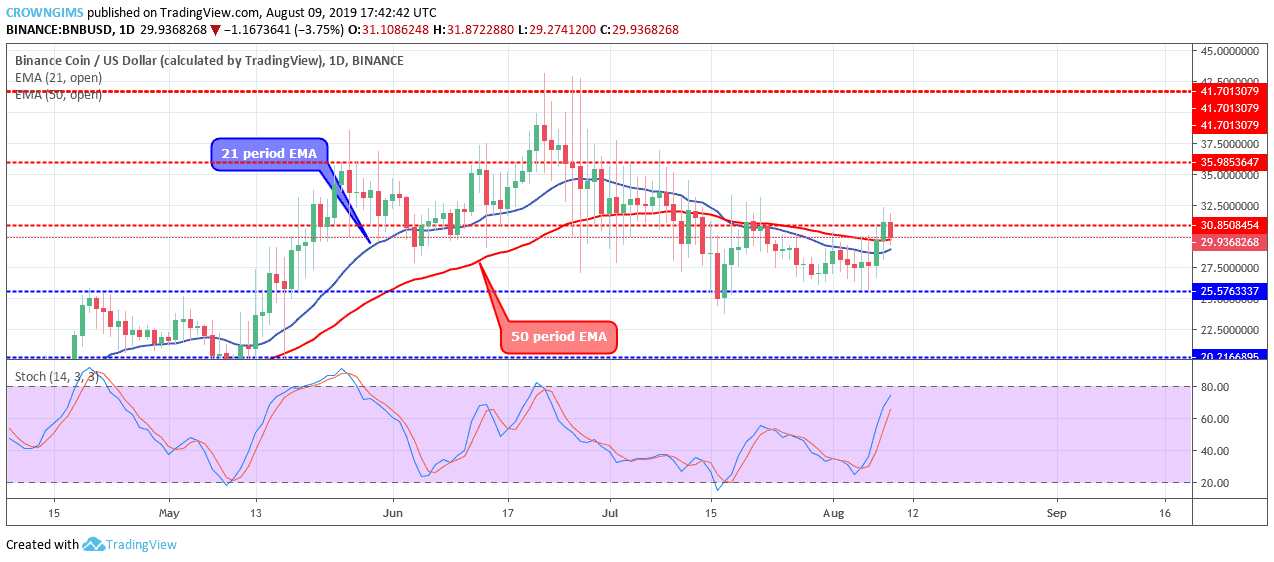
The 21 periods EMA is attempting to cross the 50 periods EMA upside and the coin is trading above the two EMAs at the supply level of $30 which connotes that the Buyers are gaining upper hand in the Binance market. The stochastic oscillator period 14 is at 60 levels with the signal lines pointing up to indicate a buy signal. In case the Buyers were able to push the price above the supply level of $30 and the daily candlestick close above the level, then, the price may rally towards the previous high, supply level of $41.
BNBUSD medium-term Trend: Ranging
BNBUSD is consolidating on the medium-term outlook. The crypto has been range-bound within the supply level of $30 and the demand level of $25 for more than a week. On August 08 several attempts were made by the Bulls to break up the supply level of $30. The level holds the price and it reversed testing the dynamic support level of 21 EMA.
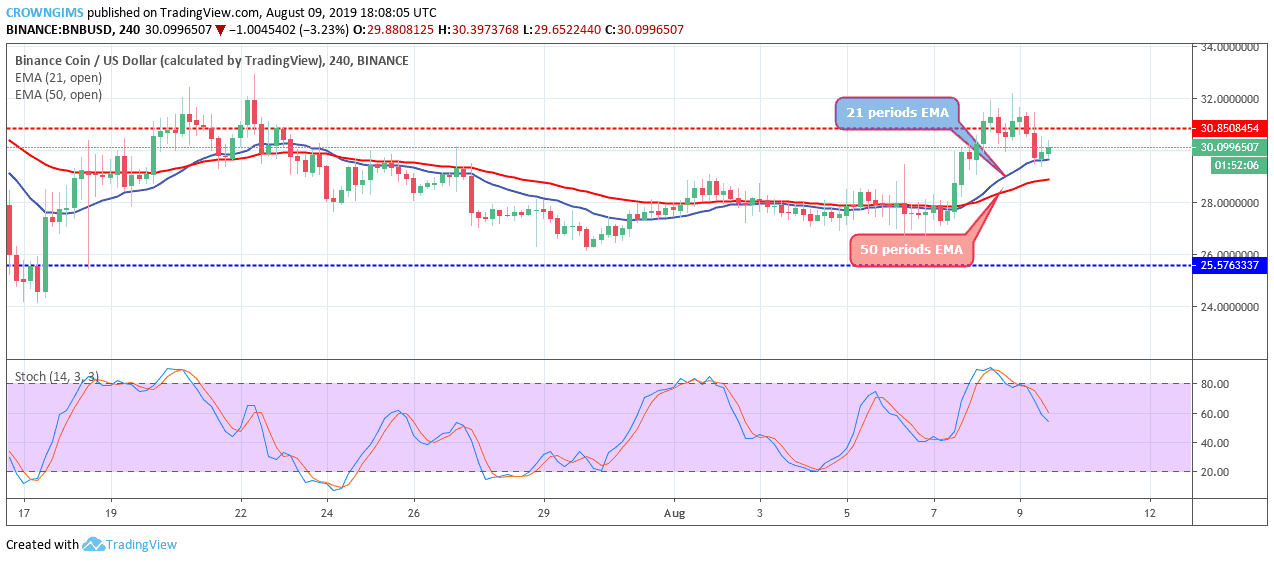
The stochastic Oscillator period 14 is at 60 levels and the signal lines bending down to indicate sell signal.
Please note: insidebitcoins.com is not a financial advisor. Do your research before investing your funds in any financial asset or presented product or event. We are not responsible for your investing results.
Join Our Telegram channel to stay up to date on breaking news coverage