Join Our Telegram channel to stay up to date on breaking news coverage
A line of price corrections had taken place in the BNB/USD market operations as the crypto’s price may hike after it reached a notable lower-trading spot. Yesterday’s trading session recorded a low of $272.81 and a high of $286.33. The market possesses a minute positive percentage rate of 0.87 as it trades around $288.50 at the time of writing.
Binance Coin Price Statistics:
BNB price now – $288.50
BNB market cap – $46.6 billion
BNB circulating supply – 161.3 million
BNB total supply – 161.3 million
Coinmarketcap ranking – #5
Binance Coin Market
Key Levels:
Resistance levels: $320, $350, $380
Support levels: $250, $225, $200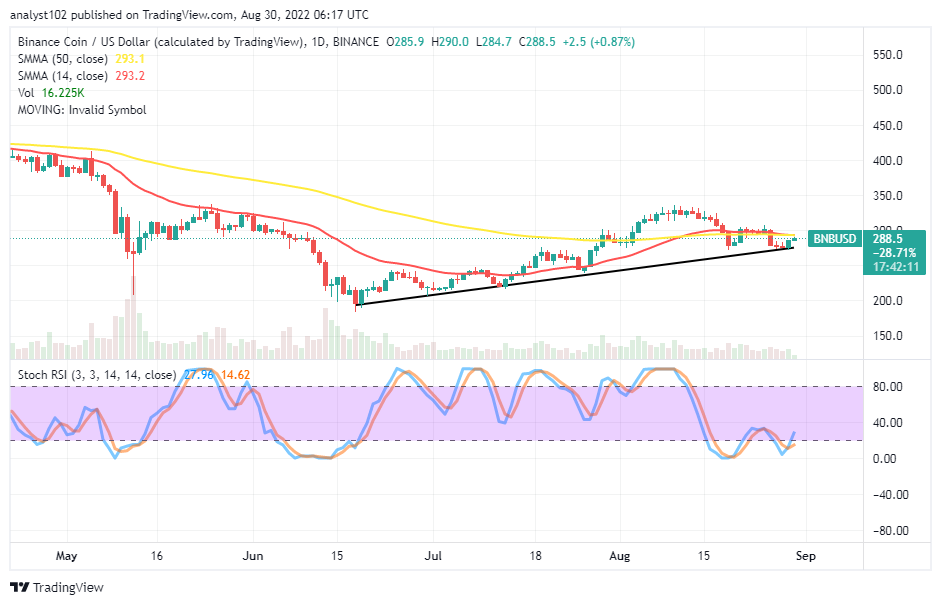 BNB /USD – Daily Chart
The daily chart reveals Binance Coin market may hike as it trades against the valuation of the US fiat currency at a low point underneath the SMAs. The 14-day SMA indicator has conjoined with the 50-day SMA indicator, given value lines of $293.1 and $293.2 as the key resistances to the current trading worth. The Stochastic Oscillators have somewhat crossed northbound to place at 14.62 and 27.96 range values. It shows a swing high may potentially play out soon.
Your capital is at risk.
Will the BNB/USD market buyers maintain a stance around the bullish trend line drawn?
The BNB/USD market buyers will maintain a sustainable stance around the bullish trend line drawn underneath the SMAs as the crypto economy may hike furthermore. With the emergence of yesterday’s smaller bullish candlestick that has led to producing another in the making, some ups may achieve soon afterward. And that can be forthcoming in a rally-moving mode. Buying orders ought to have been executed some hours before the end of yesterday’s operation. As it is, the new execution of buying orders should be wary of low-active motion that can move back to rebuild its stance at a lower-trading zone.
On the downside of the technical analysis, those resistance values indicated by the SMAs at $293.1 and $293.2 have to be the barrier point that bears are to stage a come-back. In the event of a sudden reversal against the bullish candlesticks that have featured since yesterday, the motion may lack the capacity force to reach a low point around the $250 support level.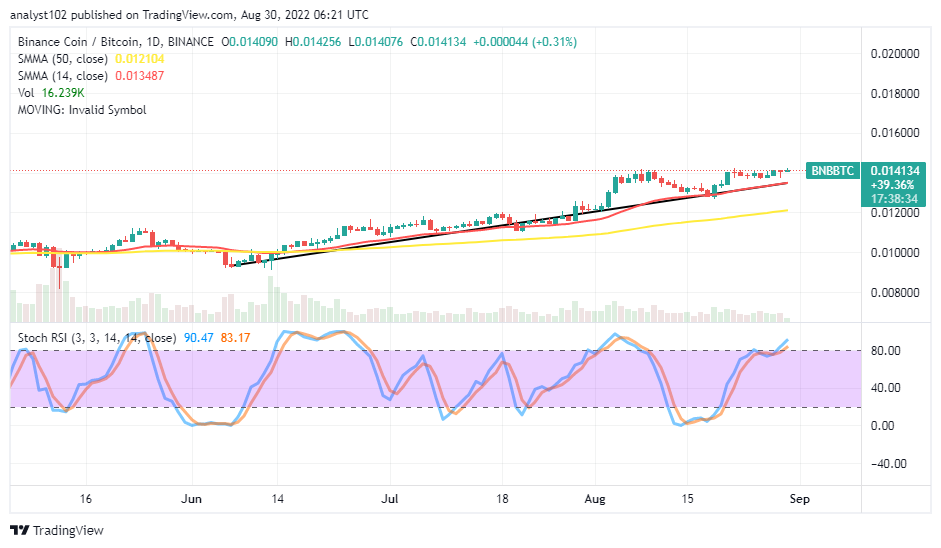
BNB/BTC Price Analysis
Binance Coin’s trending ability paired with Bitcoin has continued to keep a bullish trading outlook. There has been a situation where the price ran into a correction down to the smaller SMA. But, the pairing crypto currently strives for recovery over the trading tool. The 14-day SMA indicator is above the 50-day SMA indicator. The Stochastic Oscillators have penetrated the overbought region to the positions at 83.17 and 90.47 range values. The base crypto may still feebly push north against its counter crypto to experience a pit stop before, tending to resort to another round of corrections afterward.
Read more:
- How to buy Binance Coin
- How to buy cryptocurrency
Join Our Telegram channel to stay up to date on breaking news coverage