Join Our Telegram channel to stay up to date on breaking news coverage
BCH Price Prediction – September 22
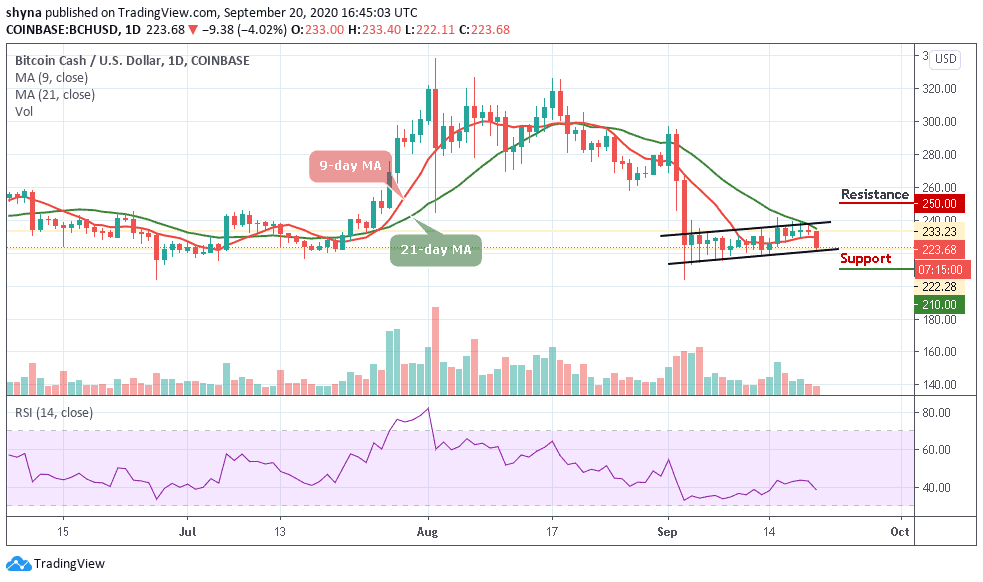
Bitcoin Cash (BCH) upsurge astounds the intraday traders. The price movement indicates a breach of the immediate resistance level.
BCH/USD Market
Key Levels:
Resistance levels: $235, $245, $255
Support levels: $195, $185, $175
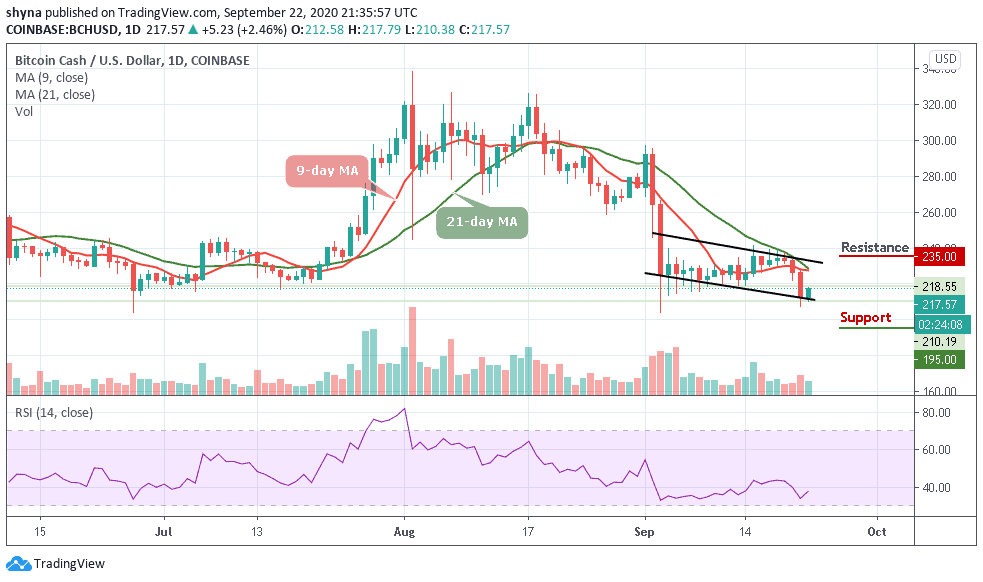
BCH/USD seems to be picked up its pace as the coin is rising towards the $220. Following the recent price-drop, Bitcoin Cash is currently facing the 9-day and 21-day moving averages. A break above the upper boundary of the channel may likely produce a huge green candle to the upside, reaching resistance levels at $235, $245, and $255 levels. By then, the BCH market will follow a bullish run.
What to Expect from Bitcoin Cash (BCH)
By observing the movement of the BCH coin, it has been showing an uneven movement with several rises and falls. BCH/USD has not been able to maintain a consistent bullish run. As the RSI (14) moves to cross above the 40-level, a precise bullish cross might reveal an additional buy signal for the market and it may continue to show signs of an upward movement in the market soon.
In other words, a bearish step back is likely to roll the market back below the lower boundary of the channel with a possible break down to $195, $185, and $175 supports, establishing a new monthly low for the market. Looking at the chart, we can see that the trading volume is rising slowly, giving a sign of an upcoming big move.
When compares with Bitcoin, the BCH bears are still showing a strong commitment by pushing the market price towards the south. Following the recent negative sign, the trend may continue to go down if the sellers can continue to pump more pressure into the market further.
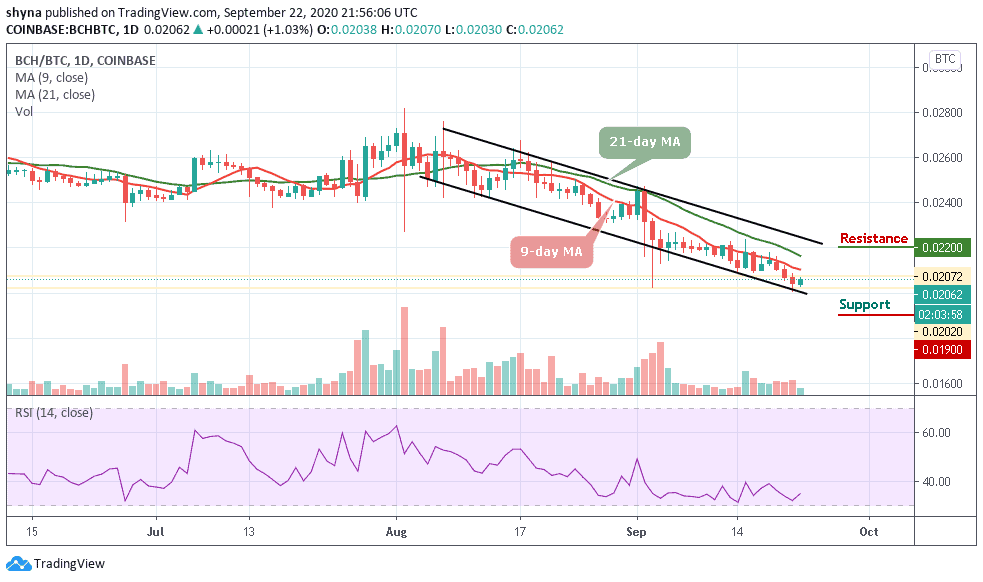
However, as the RSI (14) is hovering around level 0.0206 BTC, if the buyers can hold the support of 0.0210 BTC, the market price may likely resume an upward trend and possibly cross the 9-day and 21-day moving averages to touch the resistance level of 0.0220 BTC and above but more falls could lower the price to 0.0190 BTC and below.
Join Our Telegram channel to stay up to date on breaking news coverage