Join Our Telegram channel to stay up to date on breaking news coverage
Bitcoin (BTC) Price Prediction – September 22
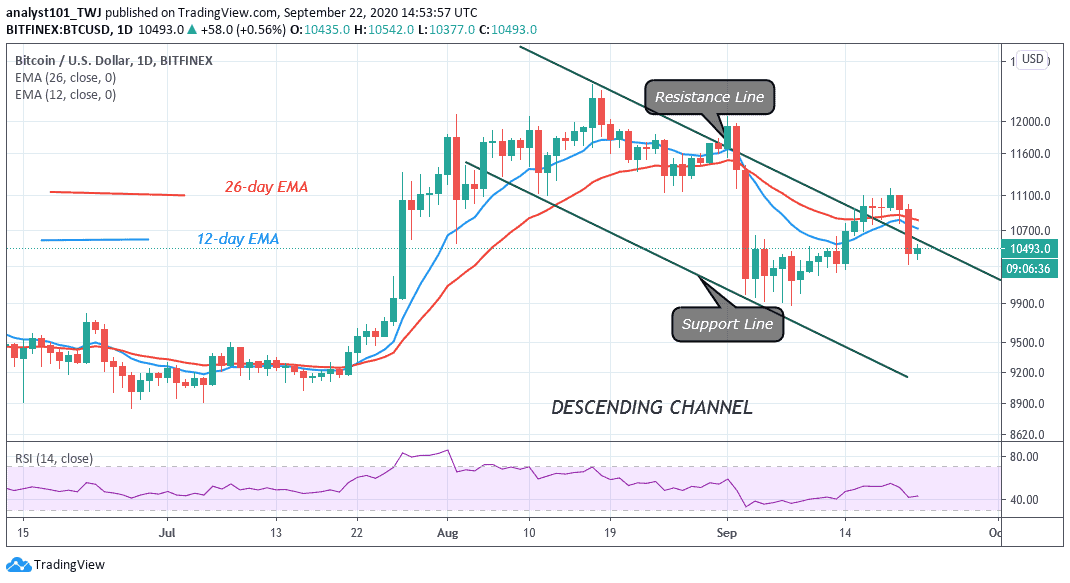
The BTC/USD is still within the limits of a bearish flag structure because the price is trading in the minor negative territory.
BTC/USD Long-term Trend: Ranging (Daily Chart)
Key levels:
Resistance Levels: $11,000, $11,200 $11,400
Support Levels: $9,800, $9,600, $9,400
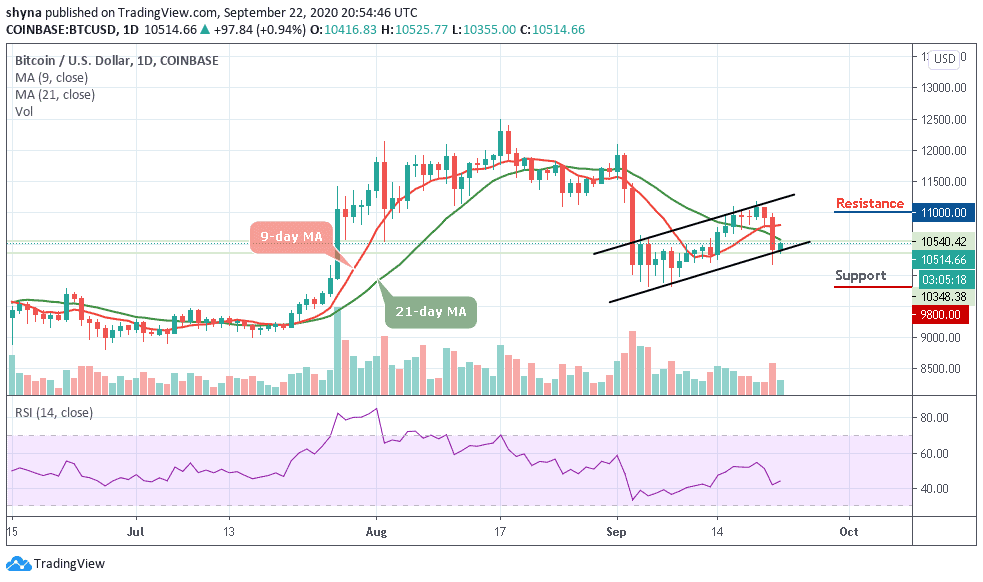
A couple of days ago, BTC/USD experienced a serious free-fall as the daily chart reveals. Since then BTC/USD has been steadily decreasing as the coin is seen trading below the 9-day and 21-day moving averages at $10,514. Meanwhile, for the bulls to regain their momentum, they must take the price up to $10,700 to cross above the 21-day moving average.
Where is BTC Price Going Next?
Meanwhile, the market has remained in the consolidation mode at the lower boundary of the channel, deciding on the next move. However, it can be expected that the market may continue to sell as soon as the declines come together. If the bulls show a strong commitment, BTC/USD could rise to the critical resistance levels of $11,000, $11,200, and $11,400. The technical indicator RSI (14), though on the negative is still giving some bullish signals.
Looking at the daily chart, BTC/USD attempted to develop a recovery but still trying to break above the moving averages to $10,800 on the upside. Weak upward momentum could affect the Bitcoin bulls, although bears should be able to push the price towards $10,000 to increase the chances of a downward scenario which may lead the price to $9,800, $9,600, and $9,400 levels in the next downward period.
BTC/USD Medium-Term Trend: Bearish (4H Chart)
Looking at the 4-hour chart, BTC/USD is currently trading around $10,573 and above the 9-day moving average after a reversal from $10,413 where the market started trading today. Meanwhile, we can see that the bullish supply is coming up slowly in the market while the bears are trying to drag the price down.
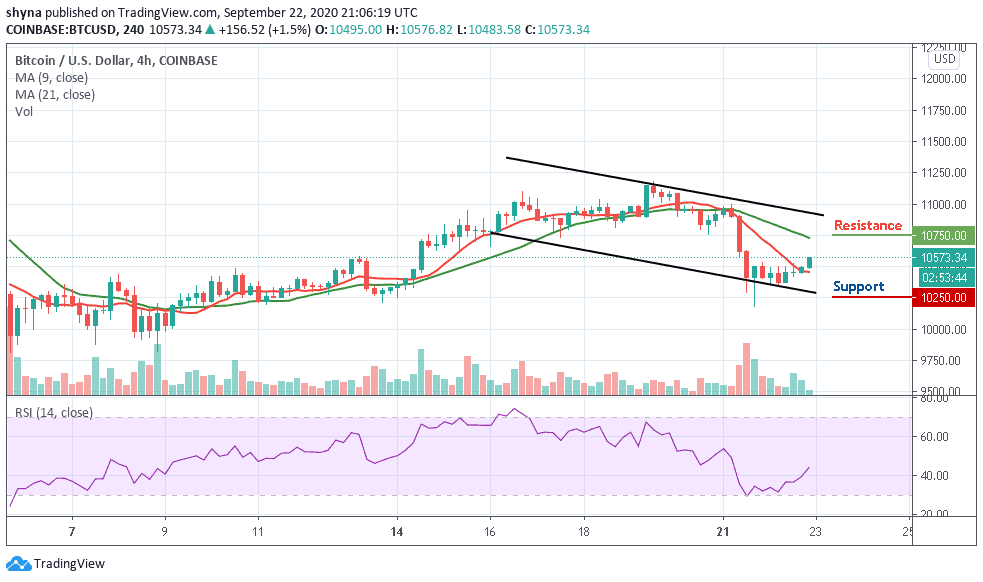
However, if the buyers can strengthen and power the market, they can further push the price to a $10,700 resistance level. Therefore, breaking the mentioned resistance could also allow the bulls to test the $10,750 and above. Inversely, the RSI (14) is currently moving around 40-level, but turning down could cause the bears to step back and may hit the support level of $10,250 and below.
Join Our Telegram channel to stay up to date on breaking news coverage