Join Our Telegram channel to stay up to date on breaking news coverage
BCH Price Prediction – March 20
BCH/USD seems to be caught between the bull and the bear as the price fluctuates sideways.
BCH/USD Market
Key Levels:
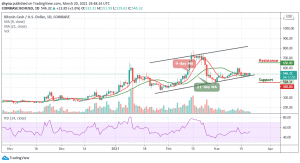
Resistance levels: $650, $700, $750
Support levels: $450, $400, $350
BCH/USD has been showing an uneven movement with several falls more than rises and it has not been able to maintain a consistent bullish run. However, the coin may show some signs of upward movement as much as it continues to move above the 9-day and 21-day moving averages. Meanwhile, for the past few days, the market has been forming a pattern where the day begins with either having an uptrend or downtrend, but towards the end, it reverses.
Where is BCH Price Going Next?
BCH/USD price continues to consolidate itself in a flag formation, waiting for a cross above the 9-day moving average. More so, the daily breakout reveals that BCH/USD moved above the 21-day MA at the opening of the market today and it is currently trading at a $546.32 level. Meanwhile, if the support gets weak, a price break-down may occur as the bears may find a new low at $450, $400, and $350 support levels.
Moreover, a bullish step back may likely roll the market to $650 resistance and could possibly move towards the $700 and $750 resistance levels. At the moment, the RSI (14) indicator is seen moving close to 50-level where a bullish cross might reveal a buy signal for the market.
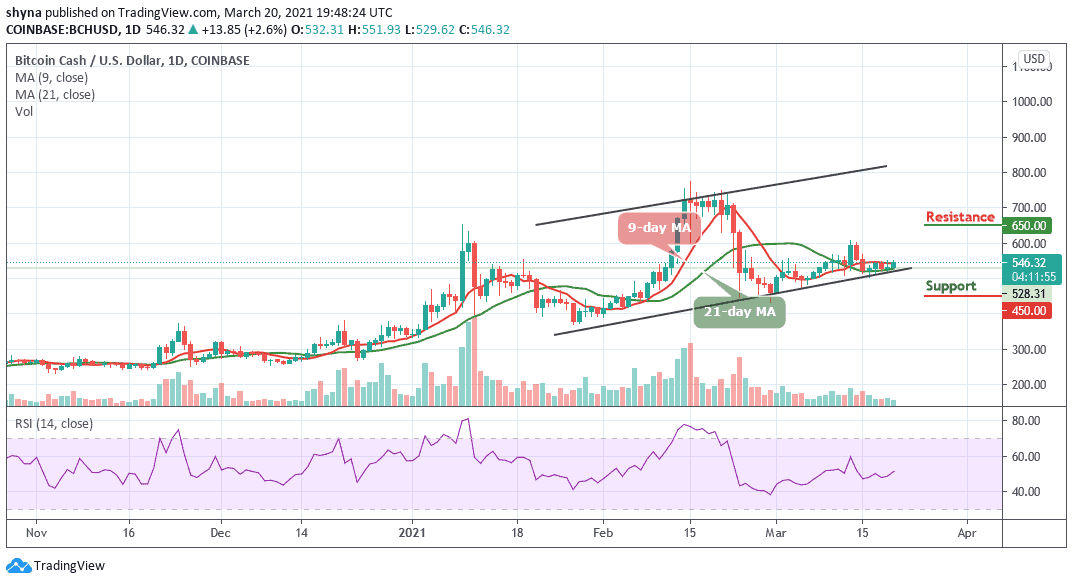
Comparing with Bitcoin, the recent sideways movement is due to the price stability in BCH trading which shows that the resistance-support is at equilibrium. Another thing to note here is that the market is preparing to change the trend and a short-term bullish breakout is most likely to play out because the technical indicator RSI (14) may be moving away from 30-level and this could cross above the 9-day and 21-day moving averages to find the nearest resistance level at 0.011 BTC and above.
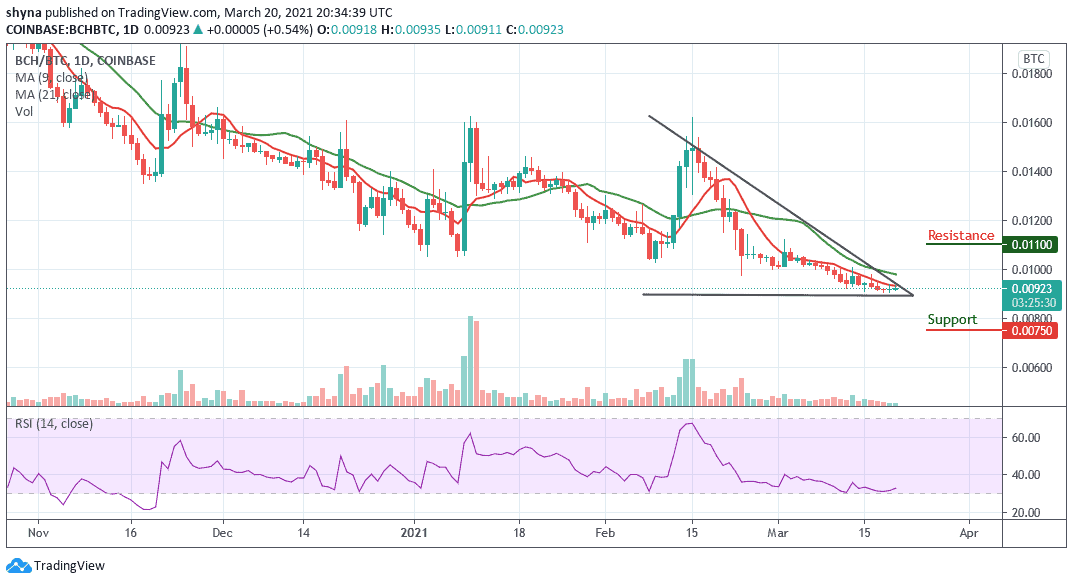
However, the only condition for the continuation of sideways movement is if the price action remains below the moving averages, then the price may be pushed below the channel to reach the support level of 0.007 BTC and below.
Join Our Telegram channel to stay up to date on breaking news coverage