Join Our Telegram channel to stay up to date on breaking news coverage
BCH Price Prediction – November 18
The Bitcoin Cash is seen retreating below the $250 support as the .market price breaks below the moving averages.
BCH/USD Market
Key Levels:
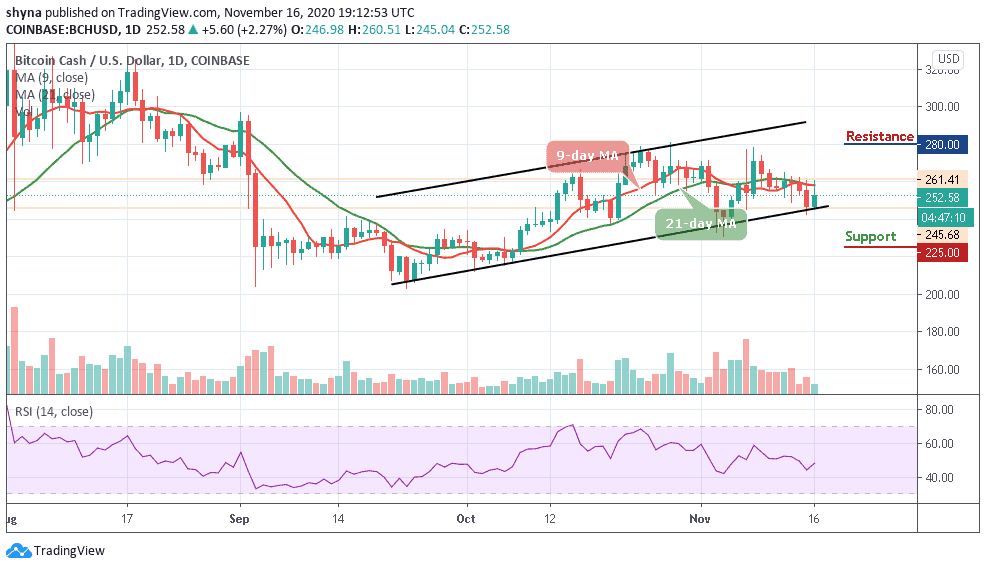
Resistance levels: $270, $280, $290
Support levels: $230, $220, $210

Despite maintaining a bullish movement for the past few days, it looks like BCH/USD is looking to slow down and settle around the $230 level. The BCH market is breaking down towards the 9-day and 21-day moving averages, touching its lowest daily level at $235.77. The current performance of the coin in the market is below the normal expectations of traders and the coin may soon recover from this downtrend.
What to Expect from Bitcoin Cash (BCH)
BCH/USD is currently trading at $244.83; the daily chart shows that the coin is trading below the moving averages within the channel. At the time of writing, the market price crosses below the lower boundary of the channel to start issuing additional sell signals as the technical indicator RSI (14) moves below the 50-level.
Nevertheless, a minimum swing below the channel may likely bring the coin to a $235 support level. Exceeding this level could take the bears to $230, $220, and $210 levels. On the other hand, a high swing above the moving averages may likely take the bulls to a key resistance level of $260. Above this, the coin can possibly trigger a bullish rally which may take the price to $270, $280, and $290 resistance levels.
Against Bitcoin, the price movement has given the bears an upper hand in controlling the market. Following the recent negative sign, the BCH/BTC trend may continue to go down as much as the sellers keep on pumping more pressure into the market.
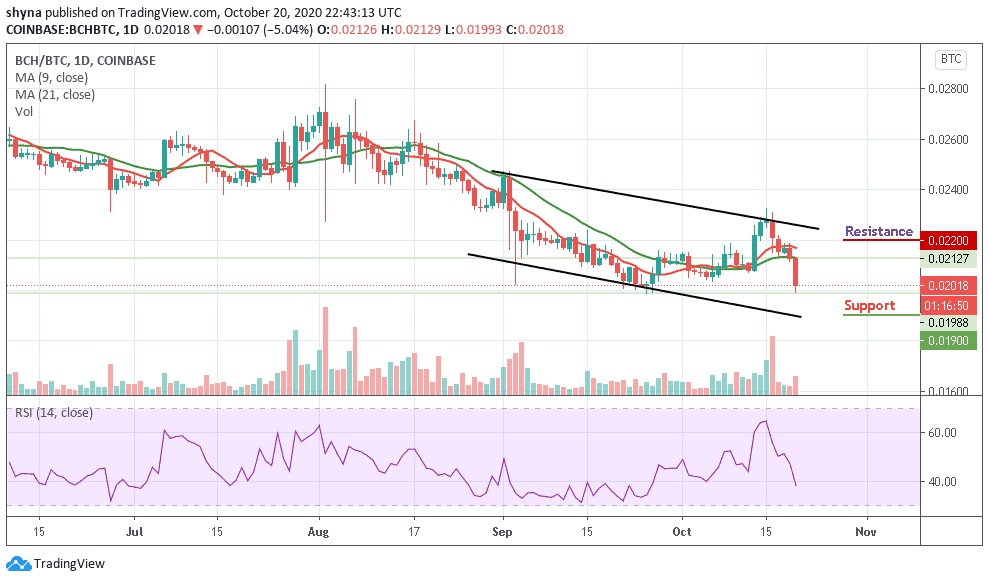
However, the market price may likely resume an upward trend if the bulls can hold the price at 1400 SAT and move towards the resistance level of 1600 SAT and 1700 SAT but as the technical indicator RSI (14) within the oversold condition, a retest could lower the price of the coin to 1200 SAT and 1100 SAT support levels.
Join Our Telegram channel to stay up to date on breaking news coverage