Join Our Telegram channel to stay up to date on breaking news coverage
BCH Price Prediction – August 26
Bitcoin Cash (BCH) is likely to take up consolidation at $280 support before a breakout comes into the picture.
BCH/USD Market
Key Levels:
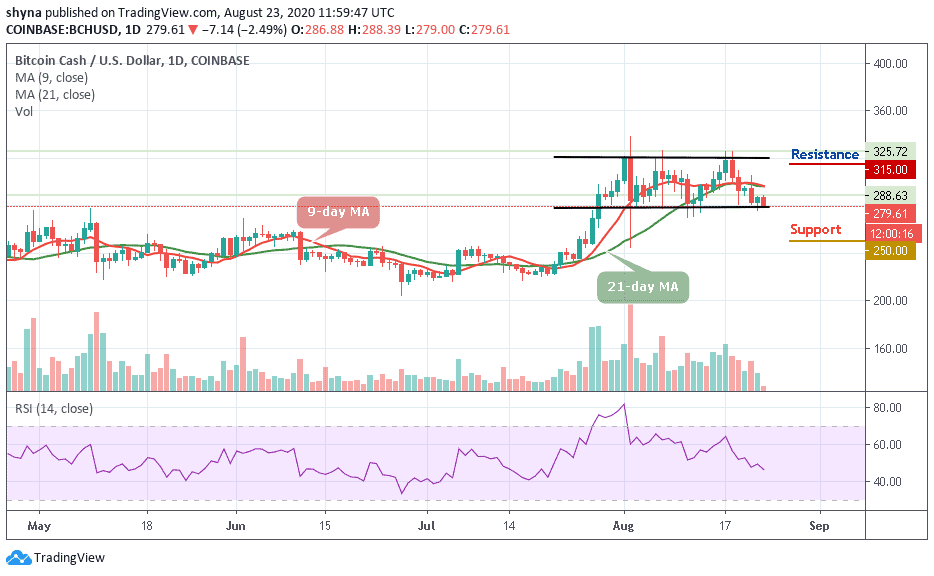
Resistance levels: $310, $320, $330
Support levels: $235, $225, $215
BCH/USD bulls are intentional in their push for gains above the 9-day and 21-day moving averages following a sharp slump to the support at $270 yesterday. The on-going recovery is happening within the confines of a bearish flag pattern. This means that BCH bulls may have to work a little harder to maintain the momentum towards $300. If not, BCH/USD is not clear of the support at $270.
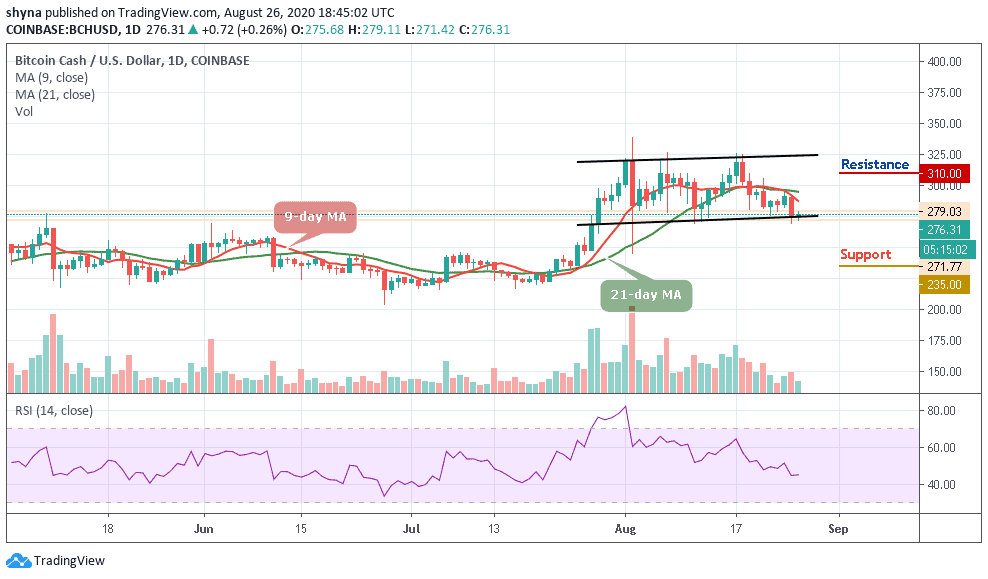
Would Bitcoin Cash Go Up or Down?
However, BCH/USD is holding at $276 which is the prevailing market value. As per the technical levels, Bitcoin Cash has potential for gains towards $310, $320, and $330 resistance levels, at least when short term analysis is considered. However, a confirmed breakout above $280 and the bearish flag pattern may aid in determining the bullish strength. Some of the hurdles that would delay the breakout include the 9-day MA at $287 and the 21-day MA at $295.
According to the technical indicator, RSI (14) is holding the position above 40-level as the trend is in the hands of the bulls. Unfortunately, the 9-day MA is crossing below the 21-day MA which may end-up into the negative region, it is evident that there isn’t enough volume to sustain gains above $300 as quickly as investors would have desired. In this case, consolidation could take precedence with Bitcoin Cash settling onto the short term support at $285. Any further bearish movement could lead to the critical supports at $235, $225, and $215.
Again Bitcoin, the market has evolved for a while in a very different way. But currently, the sellers are gaining the market as the price is trading under the 9-day and 21-day moving averages around the lower boundary of the channel while the RSI (14) moves below the 40-level.
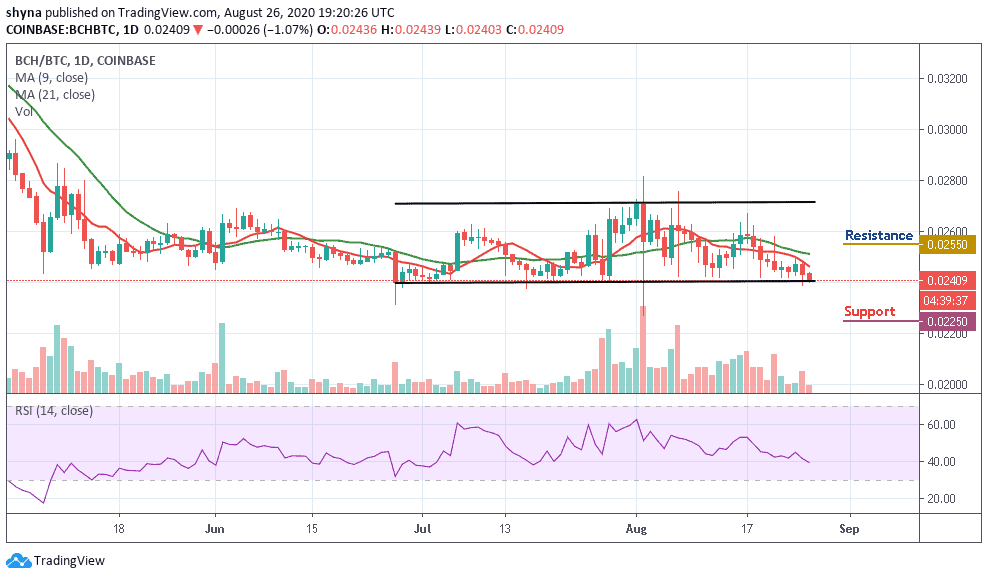
However, the downtrend is seen giving the sellers more confidence to increase their entries. More so, if the bears succeeded in the broken price, one would expect the market to fall to the support level of 0.0225 BTC and below. Meanwhile, a rebound could push it above the moving averages and increase it to the resistance level of 0.0255 BTC and above.
Join Our Telegram channel to stay up to date on breaking news coverage