Join Our Telegram channel to stay up to date on breaking news coverage
Litecoin (LTC) Price Prediction – August 26
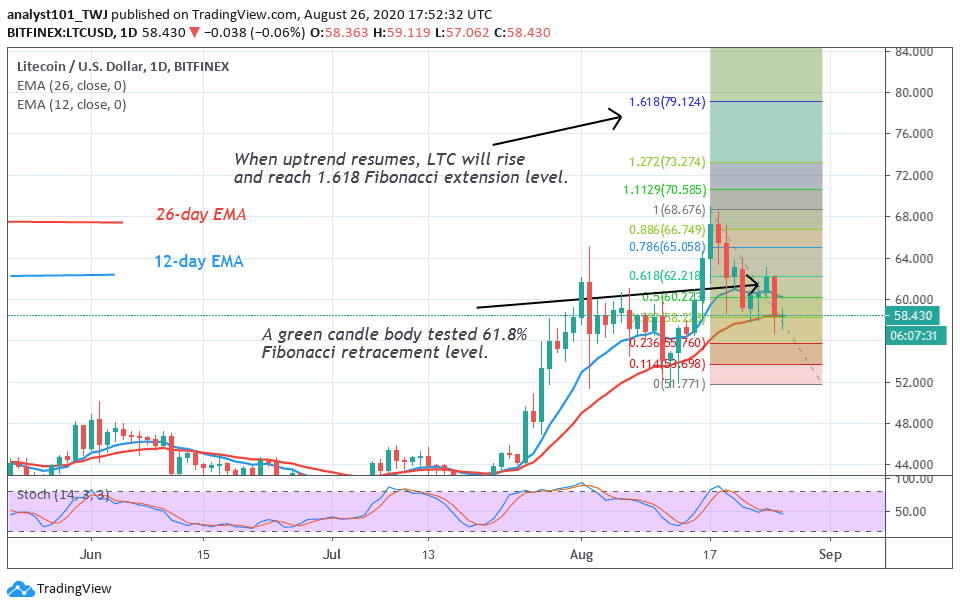
Sellers have broken below the crucial support level at $60 as the coin reached a low of $56. LTC/USD fell after two days of price tussle above the $60 support. The bulls are making frantic efforts to push the coin above the $60 price level.
LTC/USD Market
Key Levels:
Resistance Levels: $80, $100, $120
Support Levels: $50, $40, $20

The price action is indicating bullish signals above the $58 support. The $58 support is holding as buyers push the coin upward. Meanwhile, in the August 17 uptrend, LTC was resisted at the $68 high. The retraced candle body tested the 61.8% Fibonacci retracement level. This suggests that LTC will rise and reach the 1.618 Fibonacci extension level. In other words, the market will reach a high of $80. Nonetheless, if the coin rebounds above the current support, the momentum will propel price to break the $60 and $64 resistances and then proceed to retest the $68 resistance. Nevertheless, once the price breaks the $68 resistance, the coin will rise and reach the target price of $80.
Litecoin Indicator Analysis
Meanwhile, LTC is above 50% range of the daily stochastic. This indicates that the coin is in a bullish momentum. The price bars are below the 12-day and 26-day EMAs. This suggests that price may fall but the price action has countered the bearish momentum.

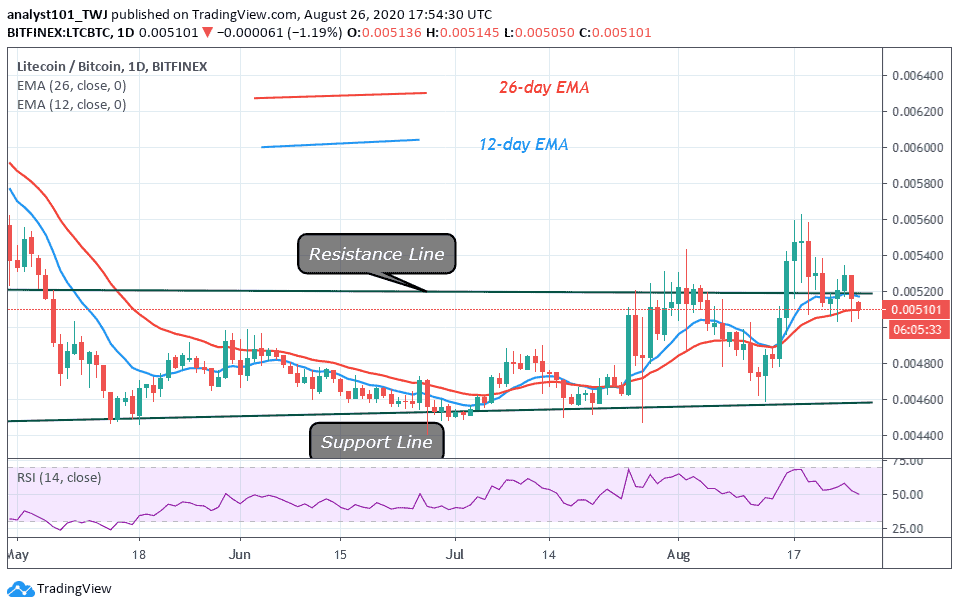
On the LTC/BTC chart, the coin is in a sideways trend. The coin is fluctuating between Ƀ0.004600 and Ƀ0.005400. Buyers attempted to break the resistance level twice but were repelled. The price fell back to the range-bound zone. The coin is at level 50 of the Relative Strength Index period 14. It indicates that the coin is at the midpoint of the centerline 50. In other words, there is a balance between supply and demand.
Join Our Telegram channel to stay up to date on breaking news coverage

