Join Our Telegram channel to stay up to date on breaking news coverage
Bitcoin (BTC) Price Prediction – August 26
Bitcoin (BTC) recovers from the dip to $11,266 but hits a wall at $11,539.
BTC/USD Long-term Trend: Ranging (Daily Chart)
Key levels:
Resistance Levels: $12,000, $12,200, $12,400
Support Levels: $10,600, $10,400, $10,200
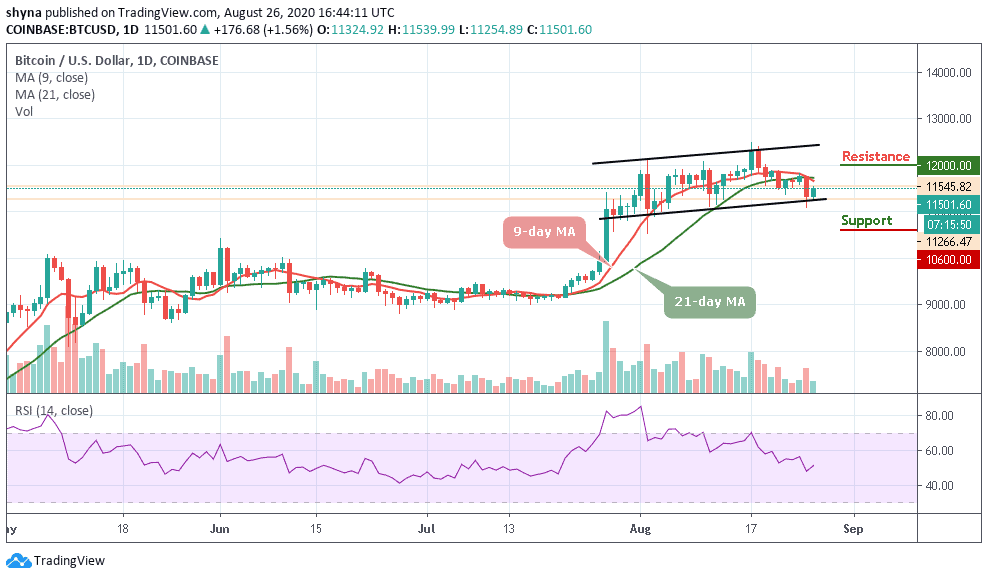
At the time of writing, BTC/USD is teetering at $11,501 amid a continuing retreat from $11,539 (immediate resistance). The technical indicator RSI (14) signals that selling activities may gain traction in the current and upcoming sessions. More so, Recovery in the last 24 hours has been steady and consistent except for the fact that selling pressure is present. For instance, Bitcoin pushed above $11,500 but could not rise past the seller congestion at $11,800.
What to Expect from Bitcoin (BTC)
Presently, BTC/USD is exchanging hands at $11,501 and the RSI (14) appears to have established support at the midline. However, the reversal has been delayed to emphasize that selling pressure is present in the market. This means that the remaining part of the journey to $12,000 would be an uphill task. However, if Bitcoin brings down the seller congestion at $11,400 and $11,200, more buyers are bound to join the market in order to capitalize on the anticipated spike above $12,000.
Nevertheless, the coin is now trading well above the $11,400 and $11,500 level. The price revisited the $11,400 level and settled well above this level. Meanwhile, the pair must break the $11,600 and $11,800 resistance levels to move into a positive zone. The key breakout zone is near the $12,000, $12,200, and $12,400 resistance levels while the critical supports are located at $10,600, $10,400, and $10,200 respectively.
BTC/USD Medium – Term Trend: Bearish (4H Chart)
Looking at the 4-hour chart, the Bitcoin price is under $11,500 and may continue to weaken if the price falls below the 9-day moving average. However, once the current correction is completed, it may likely reach $11,200 and $11,000 before the price could allow a decent recovery.
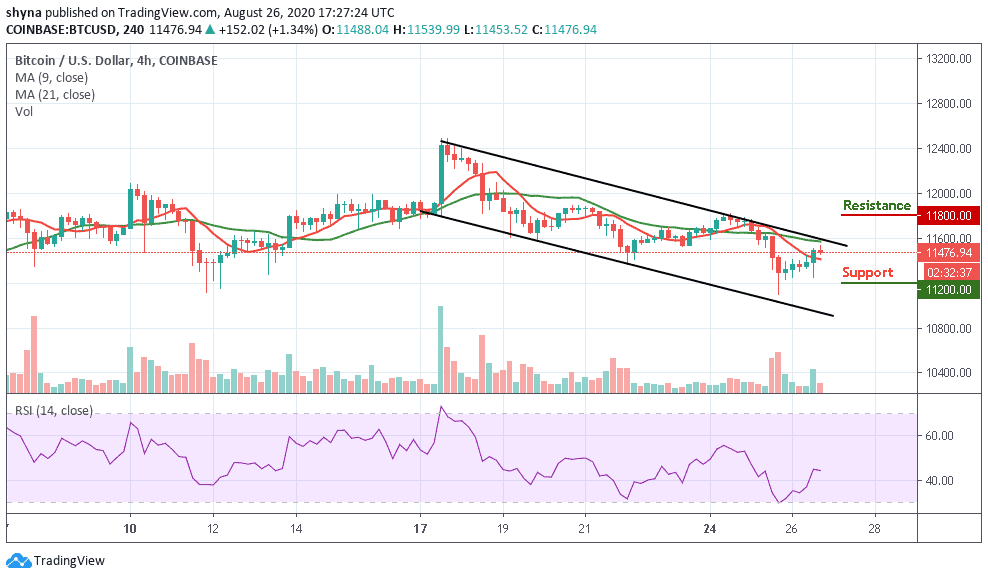
However, the technical indicator RSI (14) chart shows a sideways movement as the signal line is around the 45-level. The BTC/USD may experience further resistance of $11,800 and $12,000 levels if it raises the much-needed price recovery above $11,500.
Join Our Telegram channel to stay up to date on breaking news coverage