Join Our Telegram channel to stay up to date on breaking news coverage
The Band Protocol price prediction shows that BAND may cross above the upper boundary of the channel as the coin may benefit from the buying pressure.
Band Protocol Prediction Statistics Data:
- Band Protocol price now – $1.92
- Band Protocol market cap – $239.4 million
- Band Protocol circulating supply – 124.4 million
- Band Protocol total supply – 133.2 million
- Band Protocol Coinmarketcap ranking – #143
BAND/USD Market
Key Levels:
Resistance levels: $2.4, $2.6, $2.8
Support levels: $1.5, $1.3, $1.1
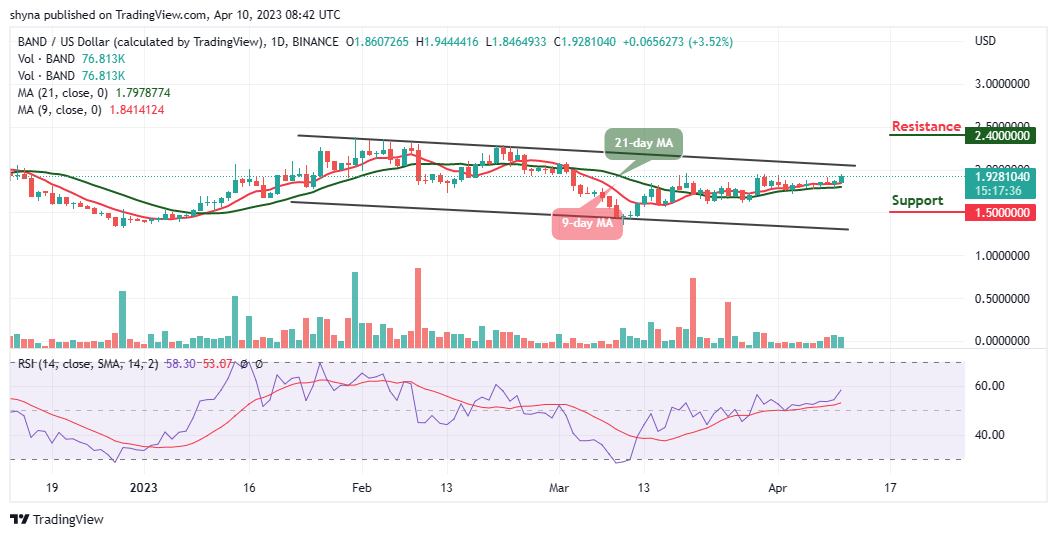
BAND/USD is trading above the 9-day and 21-day moving averages to hit the resistance level of $2.0. The coin may continue to rise if the price crosses above the upper boundary of the channel. Meanwhile, Band Protocol could begin this week on a better note, as the price could make a bullish cross above the channel. Therefore, the current performance of the Band Protocol is gradual and may inspire more bullish signals.
Band Protocol Price Prediction: BAND Price May Shoot to the North
At the time of writing, the Band Protocol price faces the upside as the coin keeps moving above the 9-day and 21-day moving averages. However, the technical indicator Relative Strength Index (14) is likely to cross above the 60-level, and there is a higher probability that the BAND price may locate the resistance levels of $2.40, $2.60, and $2.80, but any bearish slide toward the lower boundary of the channel may hit the supports at $1.5, $1.3, and $1.1 respectively.
Against Bitcoin, the BAND price is moving to cross above the 9-day moving average as the bulls are pushing the coin toward the upper boundary of the channel. However, if the Band Protocol price stays above the 9-day and 21-day moving averages, the 700 SAT could provide an additional resistance level for the next buying pressure as the technical indicator Relative Strength Index (14) crosses above the 50-level.
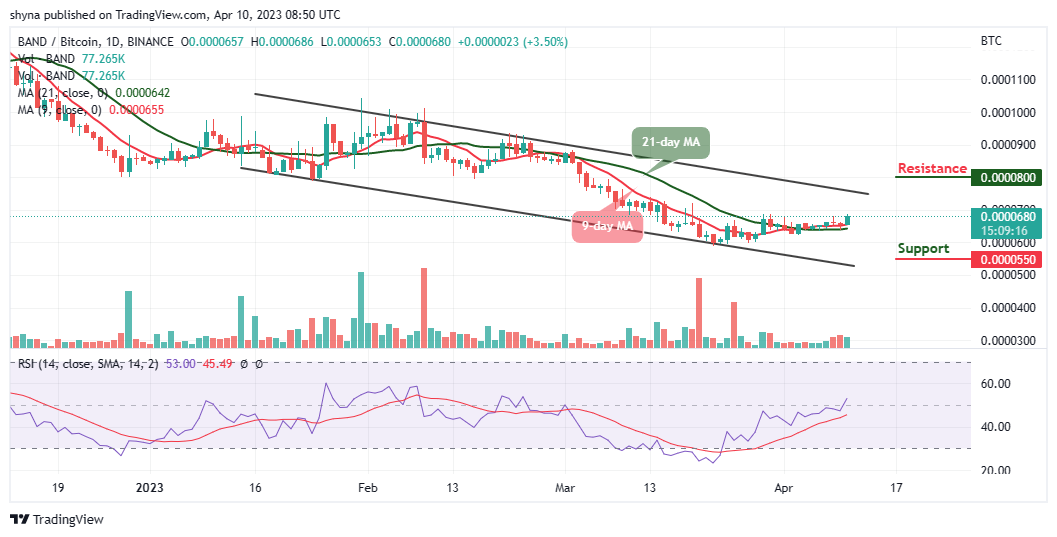
According to the daily chart, after touching the resistance level of 686 SAT, the BAND price slides a little but still keeps the price above the moving averages. On the contrary, traders may experience a downtrend if the price slides below the moving averages and could touch the support level of 550 SAT and below. However, if the current level can act as a solid line of defense against any downtrend; the resistance level of 800 SAT and above may come into focus.
Alternatives to Band Protocol
The Band Protocol is heading to the upside, and it is possible that the coin may maintain its rising toward the upper boundary of the channel. On that note, Love Hate Inu token is the first of its kind and offers an entirely new kind of use case. This is the first-ever blockchain-powered voting platform that will leverage distributed ledger technology to record immutable results, Love Hate Inu aims to cash in on a growing market as almost $3.5 million has been raised in the presale.
Join Our Telegram channel to stay up to date on breaking news coverage