
Join Our Telegram channel to stay up to date on breaking news coverage
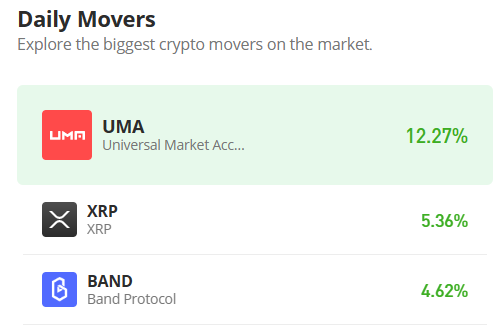
The Band Protocol price prediction shows that BAND is attempting to cross above the resistance level of $2.0.
Band Protocol Market Price Statistic:
- BAND/USD price now: $1.80
- BAND/USD market cap: $223.2 million
- BAND/USD circulating supply: 123.9 million
- BAND/USD total supply: 132.7 million
- BAND/USD coinmarketcap ranking: #144
BAND/USD Market
Key Levels:
Resistance levels: $2.30, $2.50, $2.70
Support levels: $1.40, $1.20, $1.00
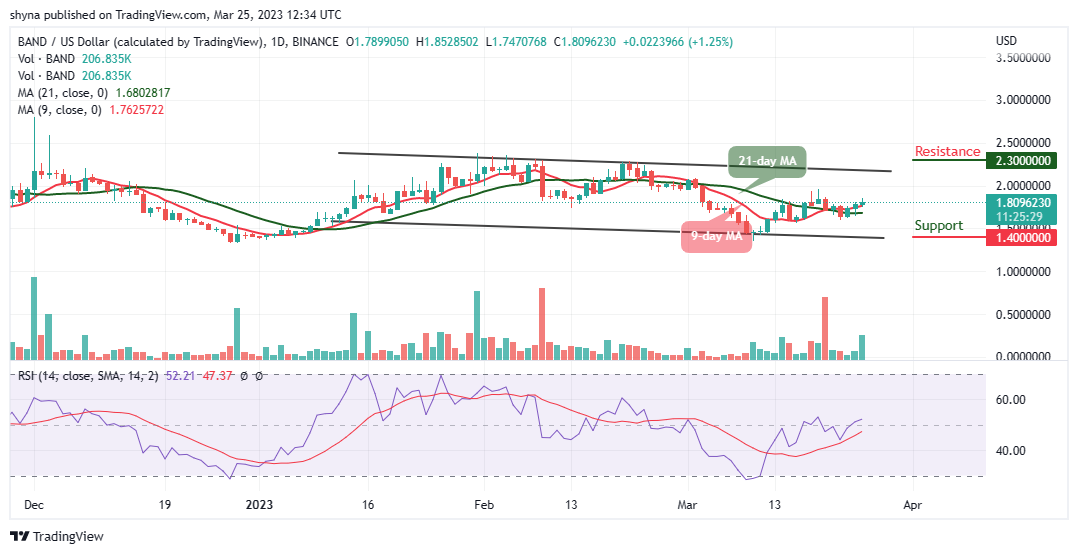
BAND/USD peaks at $1.85 today, after which the coin begins to consolidate within the channel. Meanwhile, the price not staying above $1.85 may ruin the long-term technical picture of the coin. However, the Band Protocol will have to stay above the 9-day moving average in other to guide against the downward pressure while the closest support expects the coin at $1.70, which could be a daily low.
Band Protocol Price Prediction: BAND/USD Likely to Hit $2.0 High
At the time of writing, the Band Protocol price is likely to trend to the upside. However, any further bullish movement above the upper boundary of the channel may likely push the coin to the resistance levels of $2.30, $2.50, and $2.70. On the downside, a bearish movement below the 21-day moving average could stop the initial upward movement and create bearish momentum with a focus to bring the market to the next support levels of $1.40, $1.20, and $1.00 respectively.
At the moment, the technical indicator Relative Strength Index (14) moves to cross above the 50-level, which indicates that the market may follow an uptrend. Looking at the daily chart, the 9-day moving average remains above the 21-day moving average which could allow the buyers to concentrate on stirring action to the north.
Against Bitcoin, the Band Protocol is hovering within the 9-day and 21-day moving averages. Meanwhile, following the recent positive sign, the BAND price may go down if the sellers sustain the pressure further.
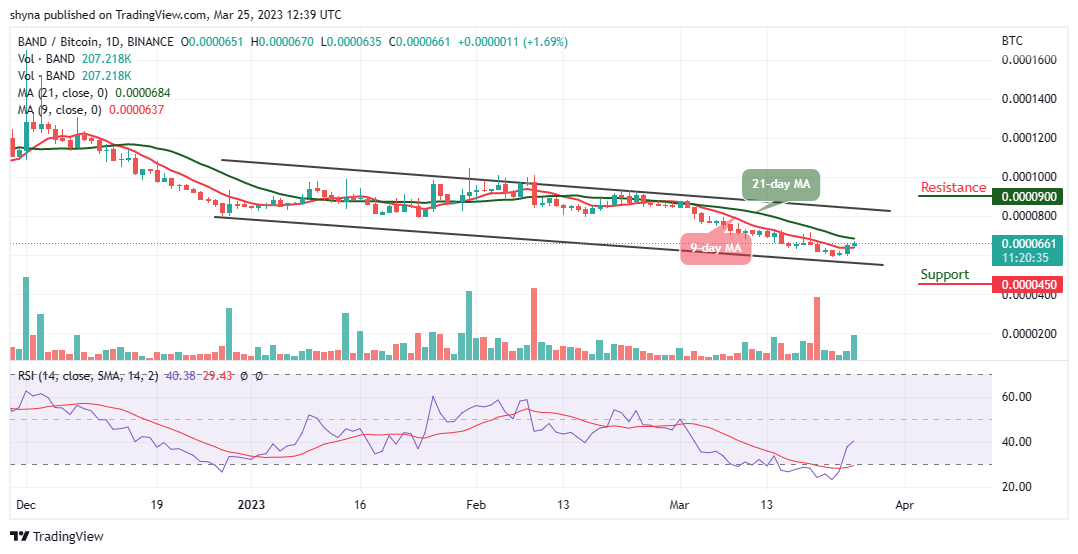
However, if the bears succeeded in breaking below the lower boundary of the channel, the market price may reach the support level at 450 SAT and below. Meanwhile, a continuous bullish movement could hit the resistance level of 900 SAT and above as the technical indicator Relative Strength Index (14) moves to cross below 40-level which could boost the bullish movement.
Alternatives to Bitcoin
The Band Protocol is heading to the upside and it is possible that the coin trade to maintain its rising toward the upper boundary of the channel as the crypto market explodes in valuation. On the other hand, Love Hate Inu will also host a vote submission platform allowing users to share ideas and create their own polls. Users will be able to create their own polls by Q4 2023. With this online voting platform, Love Hate Inu aims to cash in on a growing market as close to $2 million has been raised in the presale.
Join Our Telegram channel to stay up to date on breaking news coverage