Join Our Telegram channel to stay up to date on breaking news coverage
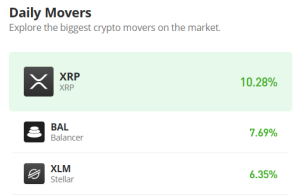
The Balancer price prediction shows that bulls are coming to dominate the market as the price moves from $6.46 to $6.99.
Balancer Prediction Statistics Data:
- Balancer price now – $6.97
- Balancer market cap – $338.8 million
- Balancer circulating supply – 48.5 million
- Balancer total supply – 56.1 million
- Balancer Coinmarketcap ranking – #106
BAL/USD Market
Key Levels:
Resistance levels: $8.0, $8.5, $9.0
Support levels: $5.5, $5.0, $4.5
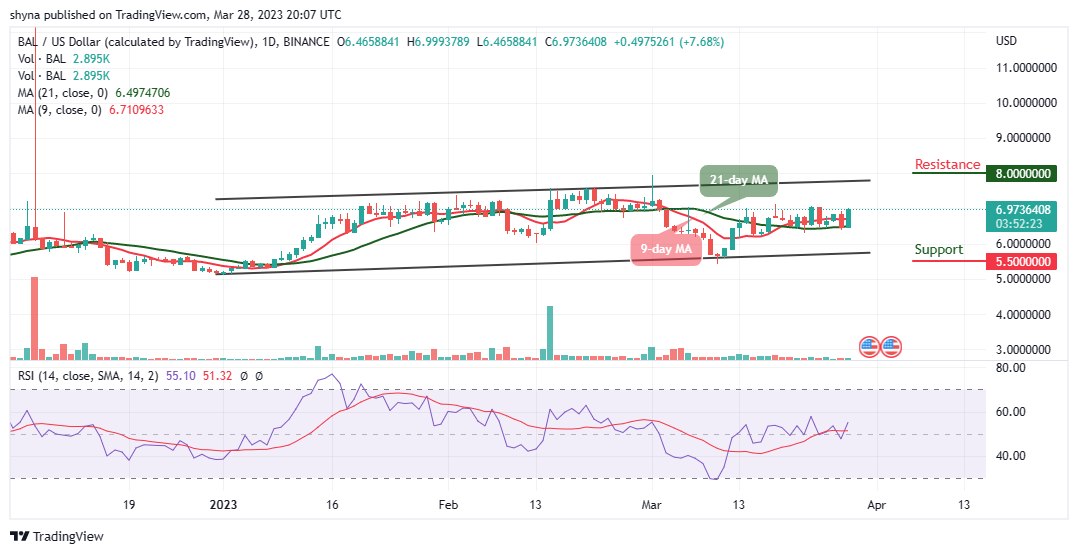
BAL/USD is positive, but it looks like it lacks enough momentum to hit the resistance level of $7.0. Following the recent price, Balancer faces a potential resistance at the $7.5 level near the upper boundary of the channel. A break above this could produce a huge green candle to the upside, reaching resistance levels at $8.0, $8.5, and $9.0. By then, the Balancer market would have been in a bullish run.
Balancer Price Prediction: BAL/USD Faces the North
According to the daily chart, the Balancer price is hovering well above the 9-day and 21-day moving averages but a bearish step into the market could drag the price toward the south which may likely roll the market back to $6.0 support. However, if the bulls fail to hold this support, a possible breakdown to $5.5, $5.0, and $4.5 supports may be visited, and this may establish another low for the market.
Looking at the daily chart, traders can see that the trading volume is rising slightly, giving a sign of an upcoming big move. Moreover, the technical indicator, Relative Strength Index (14) signal line is moving above the 40-level due to the price increase which could reveal more buy signals for the market.
When compares with Bitcoin, the daily chart reveals that bulls are showing serious commitment to Balancer trading. However, following the recent positive signs, the trend may continue to go up if the buyers continue to increase the buying pressure in the market which could hit the resistance level at 3000 SAT and above.
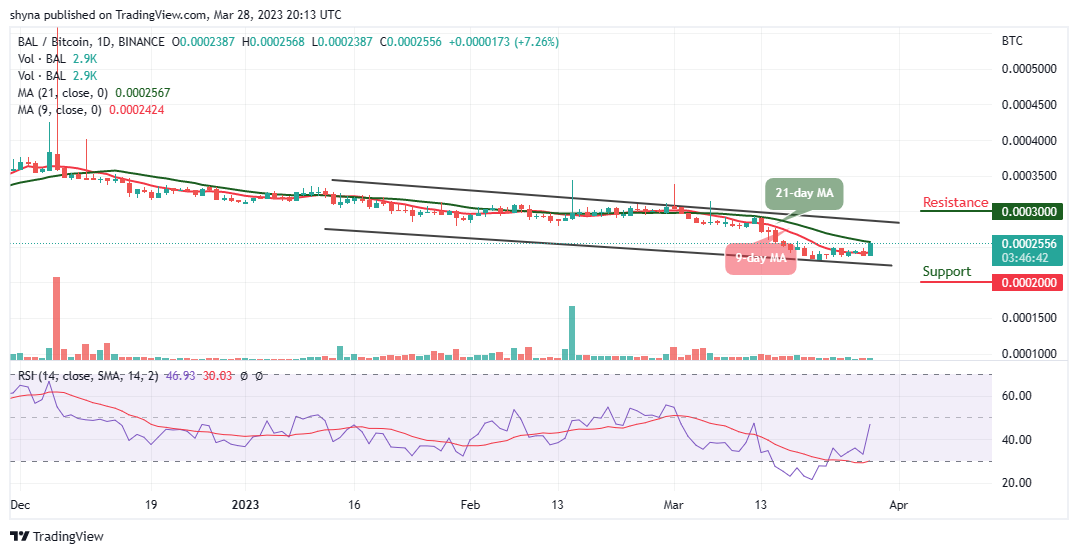
Nonetheless, the Relative Strength Index (14) signal line is seen moving to cross above the 50-level. Therefore, if the Balancer price can move above the upper boundary of the channel, the market price could follow an upward movement, pushing further can touch the resistance level of 2800 SAT but a bearish slide below the lower boundary of the channel could lower the price to the support level of 2000 SAT and below.
Alternatives to Balancer
The Balancer price is likely to experience the impact of a tailwind which could result in a spike. However, if buyers could maintain their bullishness, Balancer’s price action may break more upsides. Nowadays, meme coins are a big deal. In the past, these tokens were used only for jokes, but now they’re getting more useful. Love Hate Inu (LHINU) is making waves in the market by introducing a novel concept that has never been explored before – so far, close to $2 million has been raised in a matter of weeks since beginning its token sale.
Join Our Telegram channel to stay up to date on breaking news coverage