
Join Our Telegram channel to stay up to date on breaking news coverage
The Balancer price prediction shows that BAL could be ready for the uptrend, and it may fundamentally break above $7.0 respectively.
Balancer Prediction Statistics Data:
- Balancer price now – $6.94
- Balancer market cap – $323.7 million
- Balancer circulating supply – 46.7 million
- Balancer total supply – 54.9 million
- Balancer Coinmarketcap ranking – #108
BAL/USD Market
Key Levels:
Resistance levels: $8.0, $8.5, $9.0
Support levels: $6.0, $5.5, $5.0
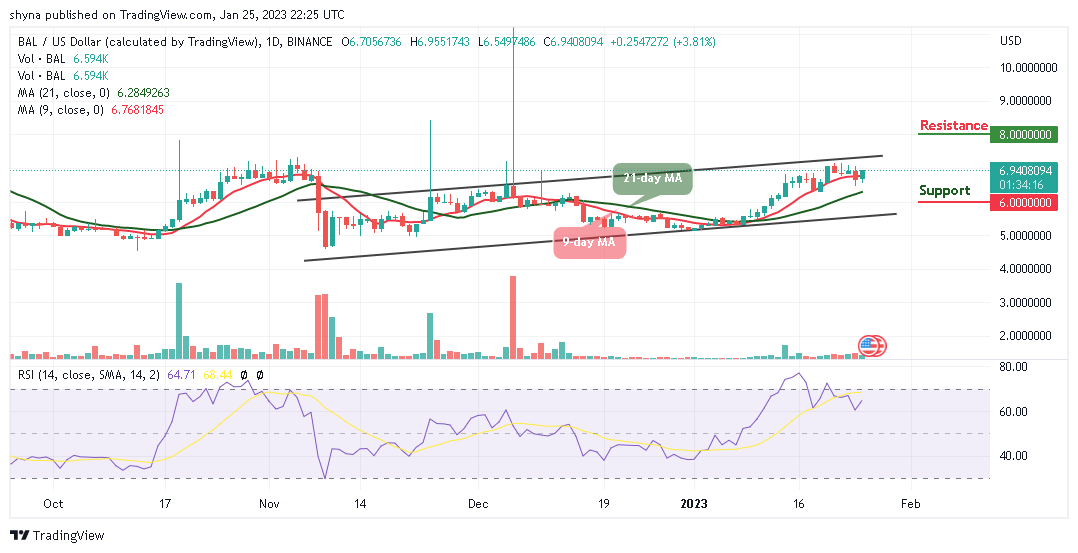
BAL/USD is trading positively above the 9-day and 21-day moving averages to increase the bullish movement. Meanwhile, the cryptocurrency might kick-start another bullish run above $7.0 if the Balancer price moves to crosses above the upper boundary of the channel. However, any positive break above this barrier is the first signal needed for the buyers to press higher.
Balancer Price Prediction: Balancer (BAL) Trades Positively
The Balancer price is looking green today, if the buyers begin to grind higher, the first resistance level may come at $7.0 as this could also be followed by $7.5. However, additional resistance levels can then be found at $8.0, $8.5, and $9.0. On the other side, if the Balancer price slides and heads toward the lower boundary of the channel, it could hit the first support level at $6.5.
However, crossing below the lower boundary of the channel may lead to the critical support levels at $6.0, $5.5, and $5.0 respectively. The technical indicator Relative Strength Index (14) is moving to cross above the 70-level, which indicates that buyers may begin to gain control of the market.
Against Bitcoin, the daily chart shows that the Balancer price is attempting to stay above the 9-day and 21-day moving averages. As soon as the price stables above this barrier, there is a possibility that additional gains could be obtained. Therefore, the next resistance level is close to the 3000 SAT level. If the price keeps rising, it could even break the 3500 SAT and above.
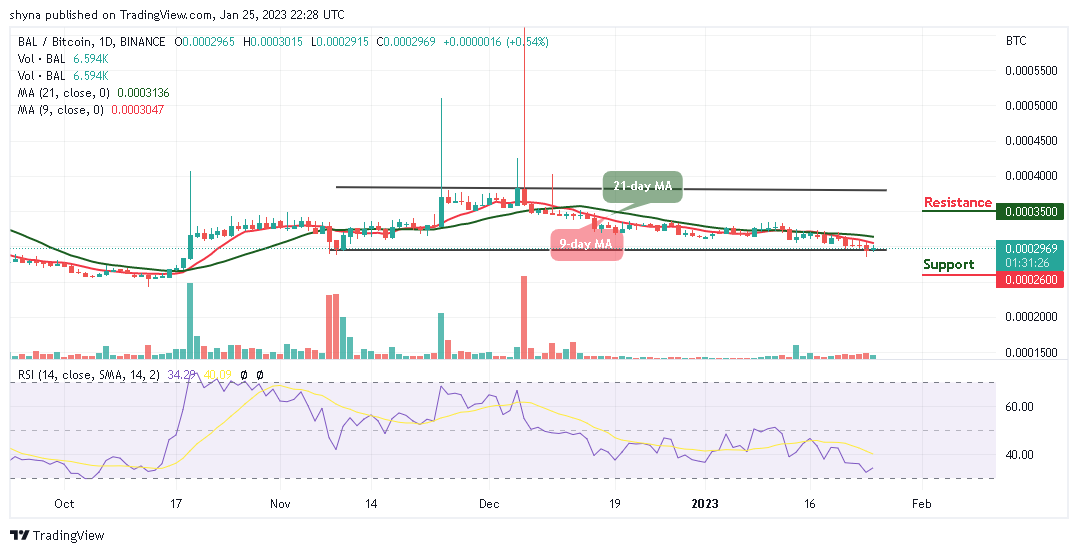
However, if bears regroup and slide below the 9-day and 21-day moving averages, 2700 SAT support may play out before rolling to the critical support at 2600 SAT and below. Meanwhile, the Relative Strength Index (14) is moving below the 40-level, suggesting bullish movement.
Balancer Alternatives
While Balancer is in the DeFi space, another emerging asset class is GameFi, with play to earn crypto games achieving high valuations in the last bull run.
One upcoming gaming project we’ve recently reviewed is Meta Masters Guild, the fastest growing cryptocurrency gaming guild of this year, tipped to become the biggest mobile gaming guild in Web3. Community members are rewarded as they play, with in-game characters tokenized as playable NFTs.
Find out more about the Meta Masters Guild project at the link below and how to invest – so far over $1.5 million has been raised in a matter of weeks since beginning its token sale.
Join Our Telegram channel to stay up to date on breaking news coverage