Join Our Telegram channel to stay up to date on breaking news coverage
Balancer (BAL) Price Prediction – June 10
It showcases the BAL/USD market trends lower high in a range outlook. Price has been trading around high and low of $8 and $7 value lines at a positive percentage rate of 2.06.
Balancer (BAL) Price Statistics:
BAL price now – $7.61
BAL market cap – $52.9 million
BAL circulating supply – 6.9 million
BAL total supply – 35.7 million
Coinmarketcap ranking – #392
BAL/USD Market
Key Levels:
Resistance levels: $8, $10, $12
Support levels: $5, $4, $3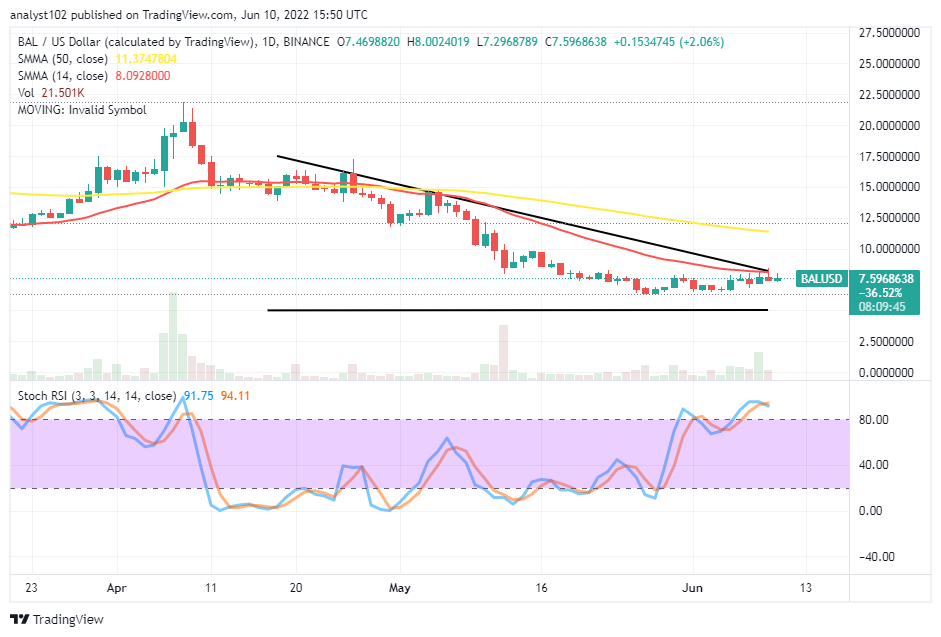
The BAL/USD daily chart reveals the crypto economy trends lower high in a range outlook beneath the SMA trend lines. The bearish trend line drew southward closely around the 14-day SMA indicator, placing underneath the 50-day SMA indicator. The horizontal line drew at the $5 support level from the bottoms of variant trading candlesticks. The Stochastic Oscillators are in the overbought region with their lines closed within.
Will the BAL/USD trade push in a consolidation moving mode past the 14-day SMA soon?
Pushes in a consolidation-moving mode past the 14-day SMA indicator may not be forthcoming soon as the crypto trends lower high in a range outlook. The market needed to go under through a necessary correctional motion even within the current range-bound zones before long-position placers launch a buying order. Aside from that, it would be for their goodness to stay clear of the trading activities for a while.
The downside of the technical analysis has it the BAL/USD market sellers have to brace up to get a sell signal entry around the smaller SMA trend line. An active downward reversal force is in the loom around the 14-day SMA. Therefore, traders should be wary of late entry position orders as jumping into the moving market at a high rate of going down can in no time witness a rebound to fake out the p[resumed moves.
BAL/BTC Price Chart
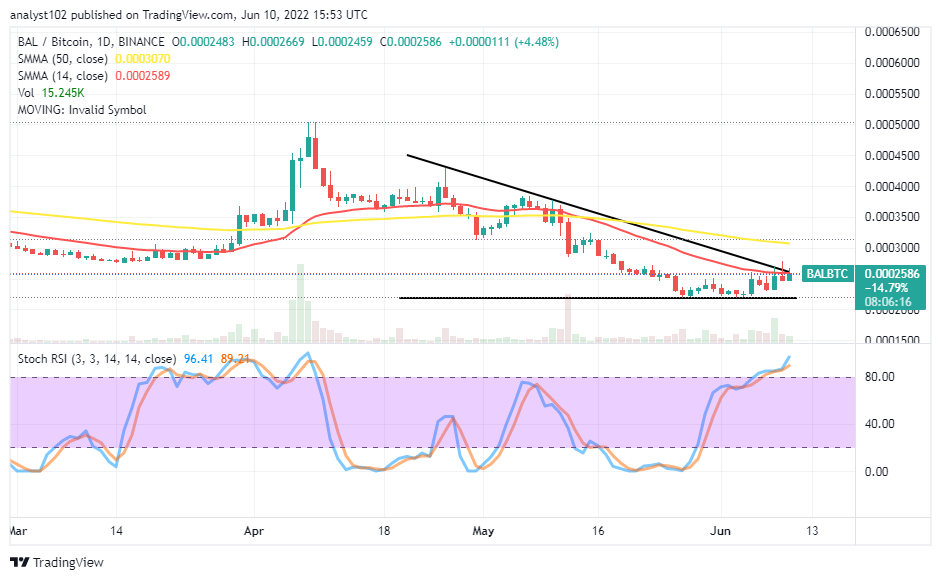
Balancer market operations against Bitcoin’s trending pace have somewhat pushed for recovery around the smaller SMA trend line. The cryptocurrency pair price trends lower high in a range outlook. The bearish trend line drew southward to play a backing purpose to the 14-day SMA indicator underneath the 50-day SMA indicator. The Stochastic Oscillators have slantingly moved into the overbought region suggesting the base crypto can still be trying to hold back against the flagship counter crypto.
Read more:
Join Our Telegram channel to stay up to date on breaking news coverage
