Join Our Telegram channel to stay up to date on breaking news coverage
AUDUSD Price Analysis – July 09
The market closed yesterday with a daily bearish candle. Today, the market has opened with another bearish candle below the two EMAs which indicate that the Bears are in control of the AUDUSD market.
AUD/USD Market
Key levels:
Supply levels: $0.701, $0.711, $0.722
Demand levels: $0.692, $0.682, $0.665
AUDUSD Long-term trend: Bearish
AUDUSD is bearish on the daily chart. The supply level of $0.701 was penetrated last week but the bullish momentum became weak and the price could not increase further. A bearish reversal candle pattern called Evening star formed at the mentioned level. AUDUSD price started fallen under the bearish pressure. The market closed yesterday with a daily bearish candle. Today, the market has opened with another bearish candle below the two EMAs which indicate that the Bears are in control of the AUDUSD market.
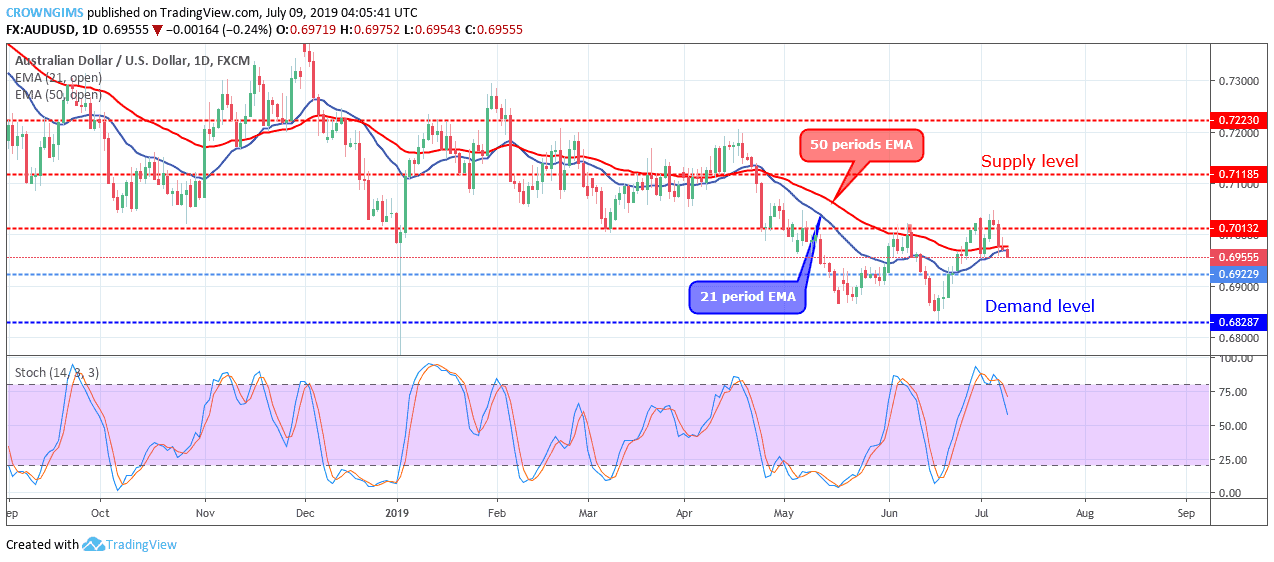
The price has broken down the 21 periods EMA and 50 periods EMA downside currently trading below the two EMAs. There is a tendency for the price to reach the demand level of $0.692 as the Bears increase their pressure. Meanwhile, the Stochastic Oscillator period 14 is below 75 levels with the signal lines point down to indicate sell signal.
AUDUSD medium-term Trend: Bearish
AUDUSD is bearish in the medium-term outlook. Bearish momentum continues in the AUDUSD market in the 4-hour chart. The bullish momentum was exhausted immediately it broke up the $0.701 supply level. The Bears took over after the formation of the inverted pin bar, the price is declining down towards the $0.692 demand level.
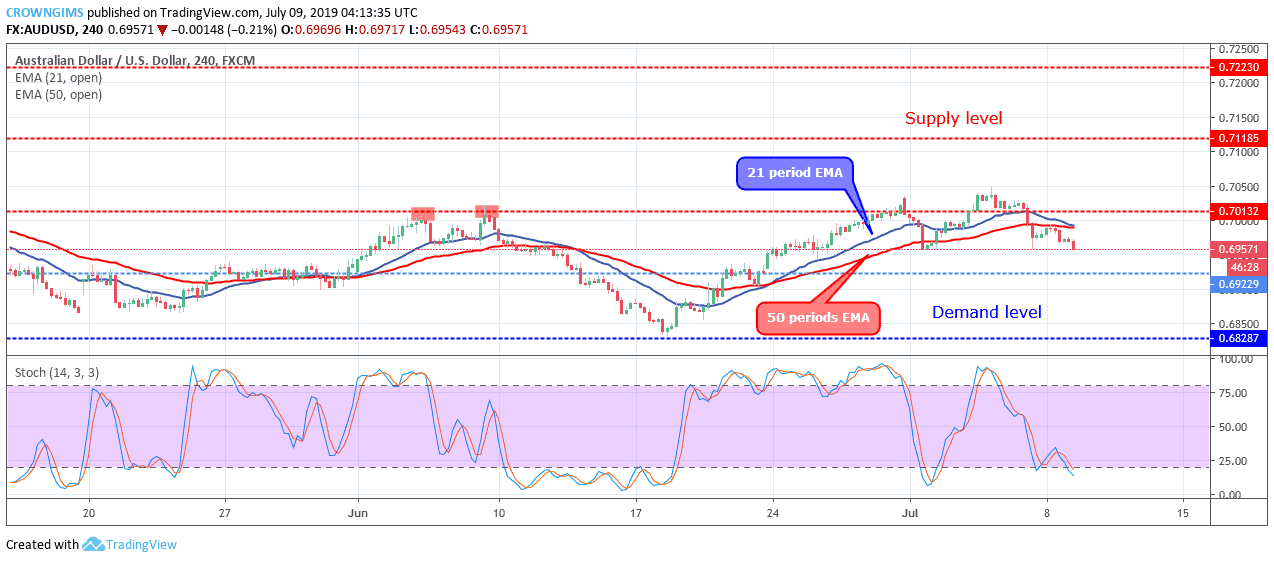
The price is trading below the 21 periods EMA and 50 periods EMA, the 21 periods EMA. The Stochastic Oscillator period 14 is below 20 levels with the signal lines pointing down which indicates a strong sell signal.
Please note: insidebitcoins.com is not a financial advisor. Do your own research before investing your funds in any financial asset or presented product or event. We are not responsible for your investing results.
Join Our Telegram channel to stay up to date on breaking news coverage