Join Our Telegram channel to stay up to date on breaking news coverage
API3 (API3) Price Prediction – November 3
As of the time of writing API3 is up 18.5% to $2.14, according to coinmarketcap data. Buying and selling activity since July has seen the crypto trade in a high and low range of $2.41 and $1.86, at an average rate of 13.69 percent positive.
API3/USD Market
Key Levels:
Resistance levels: $2.50, $3, $3.50
Support levels: $1.50, $1, $0.50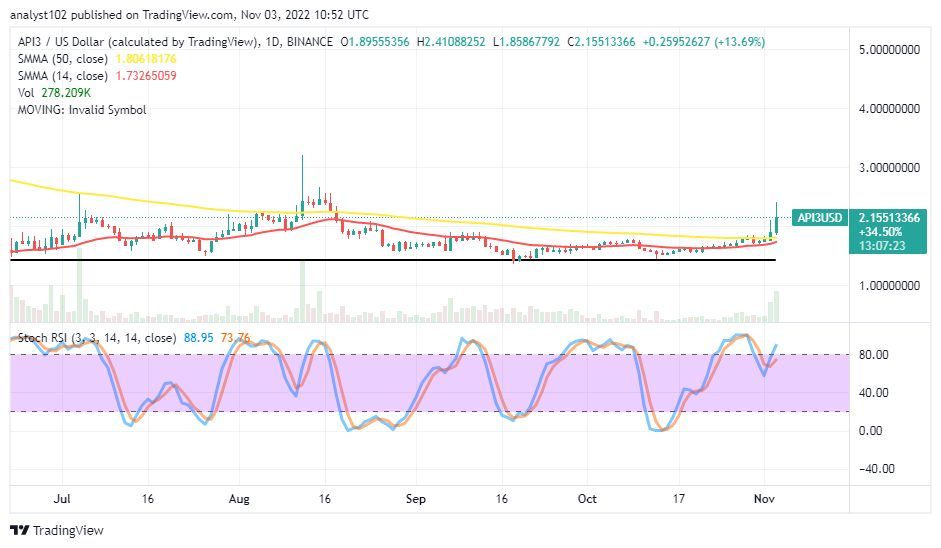
API3/USD – Daily Chart
The API3/USD daily chart showcases the crypto’s attempt to moon after breaking past the trend lines of the SMAs recently.
The horizontal line is drawn beneath the trading indicators, marking a point around the $1.42 level to highlight the position from which the price has kept on an upward trend. The 14-day SMA indicator is around $1.7327, below the $1.8062 value line of the 50-day SMA indicator.
Meanwhile, the Stochastic Oscillators are trying to cross northbound towards the 80 area, between 73.76 and 88.95.
Will the API3/USD market rise higher than prior highs attempted?
The current trading outlook in the API3/USD market operation shows the crypto trying to reach previous peaks.
A sustainable explosive push has to occur towards those former high points before bulls can be certain of the advance holding. In the interim before that sentiment is established, those taking long-positions will need to be wary of a retrace developing.
On the downside, shorters need to be on the lookout for possible rejections after today’s trading candlestick formation.
The $2.50 to $3 resistance levels will serve as the areas at which bears are most likely to regain control of the market. A convergence of candlesticks seems unrealistic before a downward-trending force can resume.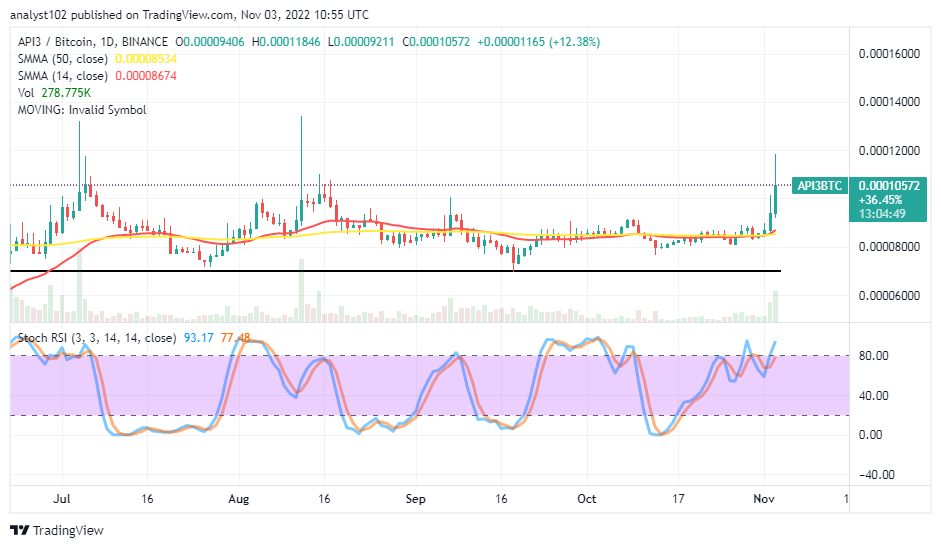
API3/BTC Price Analysis
Elsewhere, API3 is attempting to rise in the API3/BTC pair. The trading pair has been somewhat erratic when it comes to upward pressure. In a conjoining pattern, the 50-day SMA and the 14-day SMA have been heading eastward.
The Stochastic Oscillators have been swinging close to the 80 range. But, they have now swerved briefly into the overbought area in the 77.48 to 93.17 range.
There have been signs of a top shadow in the emergence of the current bullish candlestick, serving as a warning signal against seeing the base crypto maintaining sustainable highs.
The Bloomberg Terminal for Crypto Traders – Dash 2 Trade (D2T) is Selling fast
If you are unconvinced about the strength of the current API3 rally then an alternative coin to look at for much higher and more sustainable returns is Dash 2 Trade.
Dash 2 Trade is building a trading analytics and signals platform for crypto traders that it says is the Bloomberg Terminal for crypto traders that retail trdaers have been waiting for. At the heart of the ecosystem is a fully featured professional dashboard that includes reslae scoring, on-chain analytics, signals, tech indicators, and social sentiment analysis and more, all in one place.
In its ongoing presale, Dash 2 Trade has so far more than $4.4 million as it closes in on the 3rd stage of the presale which see the price rise from $0.05 to $0.0513.
This week the team disclosed that LBANK Exchange will be listing the coin shortly after the presale ends, adding to more buying pressure.
Related Articles
- 5 Altcoins to Invest in For High Returns 2022
- 5 Cryptocurrency to Buy aas Altcoin Season Stirs
- Where to Buy API3 Coin – Beginner’s Guide
Join Our Telegram channel to stay up to date on breaking news coverage