
Join Our Telegram channel to stay up to date on breaking news coverage
The bearish trend of the API3/USD market price came to an end on the 18th of September. On that day, the bulls began to take the market towards the end of the day’s trading session. And that strong bullish move continued into the trading session of the 19th day of September. This was how the bullish trend started. But along the line, the trend, as it progresses to the upside, continues to face strong resistance from the bears. But, the bulls always had the upper hand.
API3 Market Price Statistic:
- API3/USD price now: $1.7333
- API3/USD market cap: $96,983,792
- API3/USD circulating supply: 56,547,601.00
- API3/USD total supply:114,855,860
- API3/USD coin market ranking: #190
Key Levels
Resistance: $1.800, $1.900, $2.000
Support: $1.600, $1.500, $1.4000
Your capital is at risk
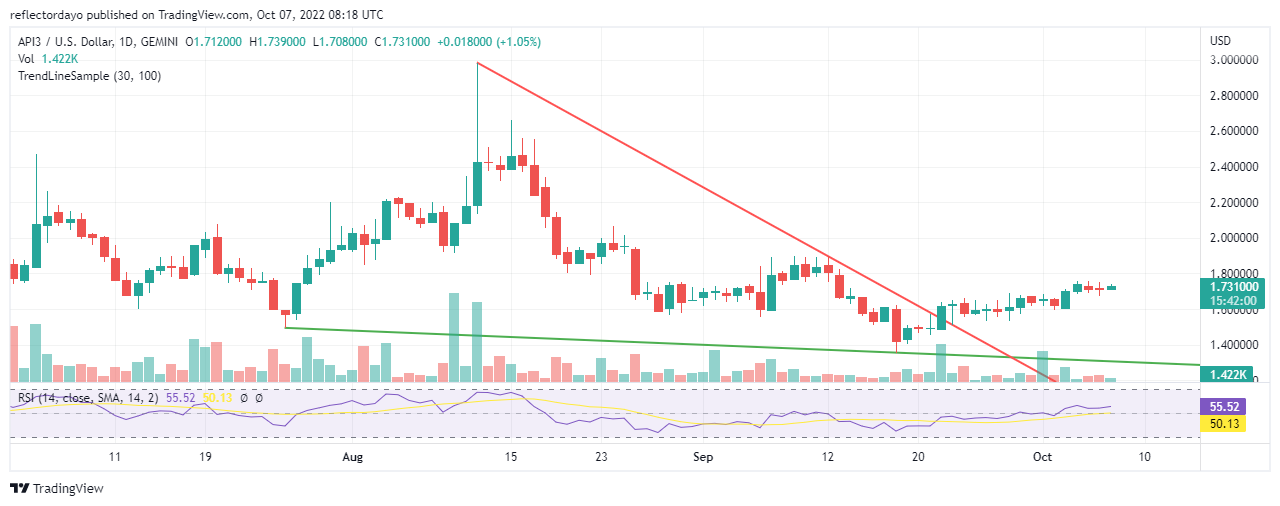
API3 Market Price Analysis: The Indicators’ Point of View
Spinning tops candlestick pattern usually points to an imminent trend reversal. As the API3/USD price progresses on its bullish journey, the chart is filled with lots of spinning top candlestick patterns. Sellers are aggressive, but bulls have the upper hand. The RSI line is not making further progress from the 55% market strength. It is just ranging at around 55% due to increasing bearish pressure. At the moment, the price seems stable at its current price.
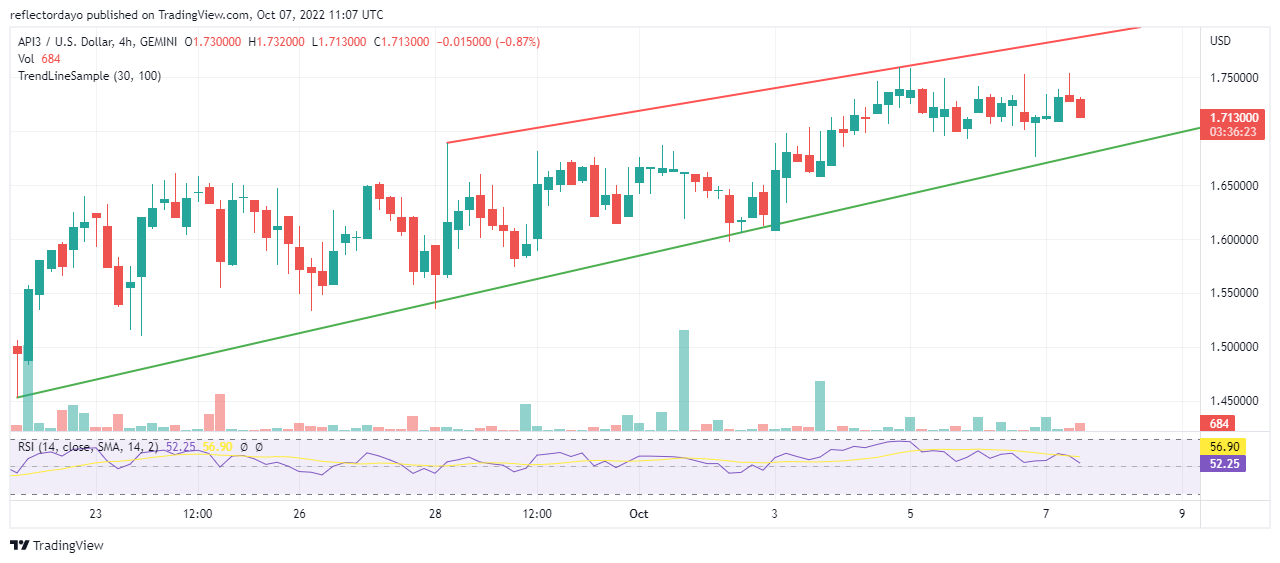
REN/USD 4-Hour Chart Outlook
From this point of view, we see that the market price is in an uptrend. It makes its progress to the upside along the resistance and support trend channel. The RSI line is also moving at 58.8%. The RSI line (in the negative zone of the indicator) has caught up with the signal line and moves slightly above it. The battle is intense between the two market players, but bulls are having the upper hand and the price may still advance further to the upside.
Join Our Telegram channel to stay up to date on breaking news coverage