
Join Our Telegram channel to stay up to date on breaking news coverage
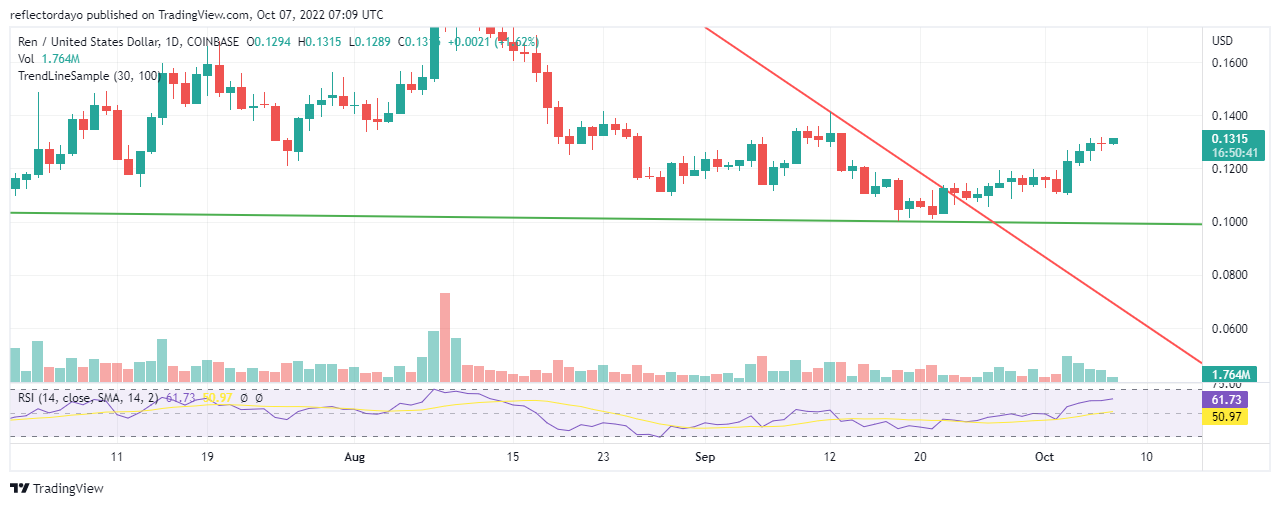
The overall market performance of REN/USD from August to the 22nd of September forms a descending triangle candlestick trend pattern. This, when it forms, means the trend will soon reverse in the bullish direction. As the formation reached its peak (that is on the 22nd of September), a bullish engulfing candle pattern appeared on the chart. As expected, a bullish trend ensued. As the bullish trend progresses, strong bearish pressure can be felt as the bullish market progresses
Ren Market Price Statistic:
- REN/USD price now: $0.1306
- REN/USD market cap: $130,516,050
- REN/USD circulating supply:999,037,500
- REN/USD total supply: 999,999,633
- REN/USD coin market ranking: #160
Key Levels
Resistance: $0.1400, $0.1500, $0.1600
Support: $0.1300, $0.1200, $0.1100
Your capital is at risk
Ren Market Price Analysis: The Indicators’ Point of View
In yesterday’s market, the faceoff between buyers and sellers did not allow the price to progress beyond the point at which the market opened. Yesterday’s trading session was represented by a spinning top candlestick pattern. That means the bearish momentum is catching up with the bullish momentum and this resulted in indecision in yesterday’s market.
In today’s market, it seems that the bulls could not be stopped as they have now again resumed a bullish trend. Usually, a spinning top candlestick pattern signifies an imminent trend reversal. The trend is expected to reverse, but it didn’t reverse although, the bears appear to still be formidable.
The movement of the RSI line is slowing down (this testifies to the increased selling pressure) and now ranging at around 61% market strength. The trend may soon reverse as bullish and bearish pressure are becoming evenly matched.
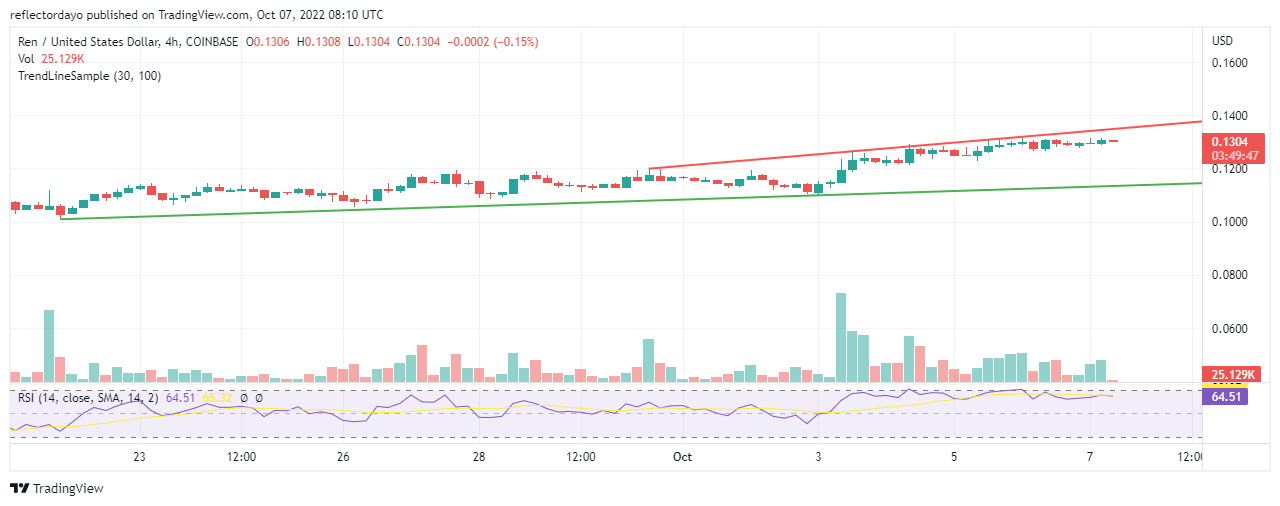
REN/USD 4-Hour Chart Outlook
Bulls are now struggling to make their progress as bears held tight to their heels. The spinning top candlesticks pattern, that keeps appearing on the chart, shows sellers’ persistence towards taking over the market. However, for now, bulls are having the upper hand in this market. And the RSI line measures 64.5% market strength.
Join Our Telegram channel to stay up to date on breaking news coverage