Join Our Telegram channel to stay up to date on breaking news coverage
The Aave price prediction reveals that the AAVE price is likely to cross above the moving averages to continue the bullish movement.
Aave Prediction Statistics Data:
- Aave price now – $70.7
- Aave market cap – $1 billion
- Aave circulating supply – 14.4 million
- Aave total supply – 16 billion
- Aave Coinmarketcap ranking – #42
AAVE/USD Market
Key Levels:
Resistance levels: $85, $90, $95
Support levels: $55, $50, $45
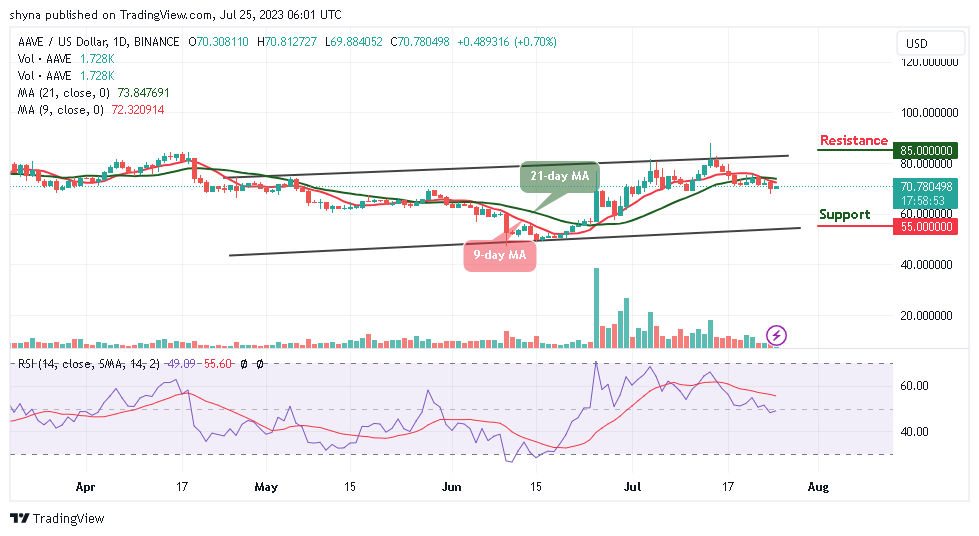
AAVE/USD is changing hands at $70.7 after the price dropped off yesterday, and consolidating within the channel. The AAVE price not crossing above the moving averages could ruin the long-term technical picture of the coin. However, Aave will have to focus on the bullish movement to guide against the downward pressure, while the closest support expects the coin at $65, which could be the daily low.
Aave Price Prediction: The Aave Price May Move Upward
The Aave price regains back toward the 9-day moving average because any movement to the downside may bring the coin to the support levels of $55, $50, and $45. However, AAVE/USD is trading at $70.7, and still moving sideways. On the upside, a sustained move above the 21-day moving average may push the price toward the upper boundary of the channel to hit the next resistance levels of $85, $90, and $95 respectively.
At the moment, the technical indicator Relative Strength Index (14) is likely to cross above the 50-level, which indicates that the market may shoot to the upside. Looking at the daily chart, there may be a need for support to be formed at around $68 to provide tight protection which could allow the buyers to concentrate on stirring action to the north.
Against Bitcoin, the Aave price is hovering below the 9-day and 21-day moving averages as the buyers aim to push the price to the upside and could rise toward the upper boundary of the channel, while the technical indicator Relative Strength Index (14) remains above the 50-level.
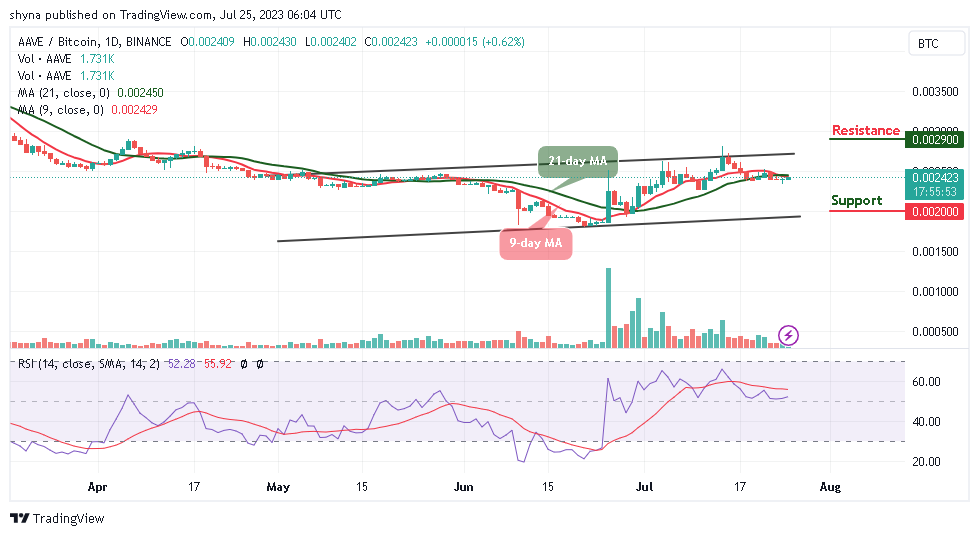
However, if the bulls succeeded in breaking above the upper boundary of the channel, the AAVE price may likely hit the potential resistance level at 2900 SAT and above. On the contrary, any bearish movement to the south could bring the price to the support level of 2000 SAT and below.
Aave Alternatives
The Aave price is hovering below the 9-day and 21-day moving averages. However, due to the current bullish movement, the coin is likely to face the upper boundary of the channel, and the more the bulls pressurized the bears, the higher the coin would reach.
Nevertheless, Wall Street Memes could be the next token to skyrocket, since launching its presale a few weeks ago, the new meme coin project has raised almost $18 million and attracted attention from some of the biggest names in crypto.
New OKX Listing - Wall Street Memes

- Established Community of Stocks & Crypto Traders
- Featured on Cointelegraph, CoinMarketCap, Yahoo Finance
- Rated Best Crypto to Buy Now In Meme Coin Sector
- Team Behind OpenSea NFT Collection - Wall St Bulls
- Tweets Replied to by Elon Musk
Join Our Telegram channel to stay up to date on breaking news coverage