
Join Our Telegram channel to stay up to date on breaking news coverage
The Kyber Network price prediction shows that KNC moves to trade above the $0.70 level as the market goes bullishly.
Kyber Network Prediction Statistics Data:
- Kyber Network price now – $0.67
- Kyber Network market cap – $116.8 million
- Kyber Network circulating supply – 170.7 million
- Kyber Network total supply – 227.9 million
- Kyber Network Coinmarketcap ranking – #176
KNC/USD Market
Key Levels:
Resistance levels: $0.85, $0.90, $.1.00
Support levels: $0.50, $0.40, $0.30
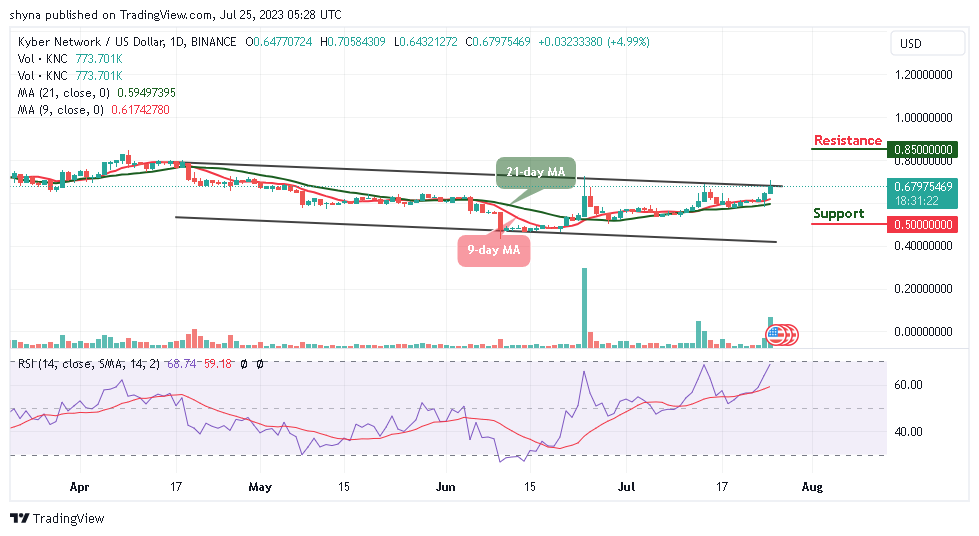
KNC/USD is currently ranging as the price hits the resistance level of $0.70, and it is likely to break above the upper boundary of the channel. At the moment, the Kyber Network price may continue to trade bullishly if the coin struggles to stay above the moving averages.
Kyber Network Price Prediction: Kyber Network (KNC) May Spike to the Upside
Looking at the daily chart, if the Kyber Network price crosses above the upper boundary of the channel; it could hit the nearest resistance level at $0.75. However, a successful break above this level could open the doors for an additional increase to the $0.80 level. In the meantime, any further bullish movement could push the coin to the potential resistance levels of $0.85, $0.90, and $1.00.
Nonetheless, as the technical indicator Relative Strength Index (14) moves to cross into the overbought, the nearest support could be found at the $0.72 level. Meanwhile, if there is a bearish break below the 9-day and 21-day moving averages, KNC/USD could test the support level of $0.065 before heading toward the lower boundary of the channel. However, any further bearish movement could lead the price toward the support levels of $0.50, $0.40, and $0.30 respectively.
When compares with Bitcoin, the Kyber Network price is also moving to break above the upper boundary of the channel. However, if the price remains above the 9-day ad 21-day moving averages, there is a possibility that additional resistance levels may be created in the long term. In other words, any bearish cross below the moving averages could hit the critical support at 1900 SAT and below.
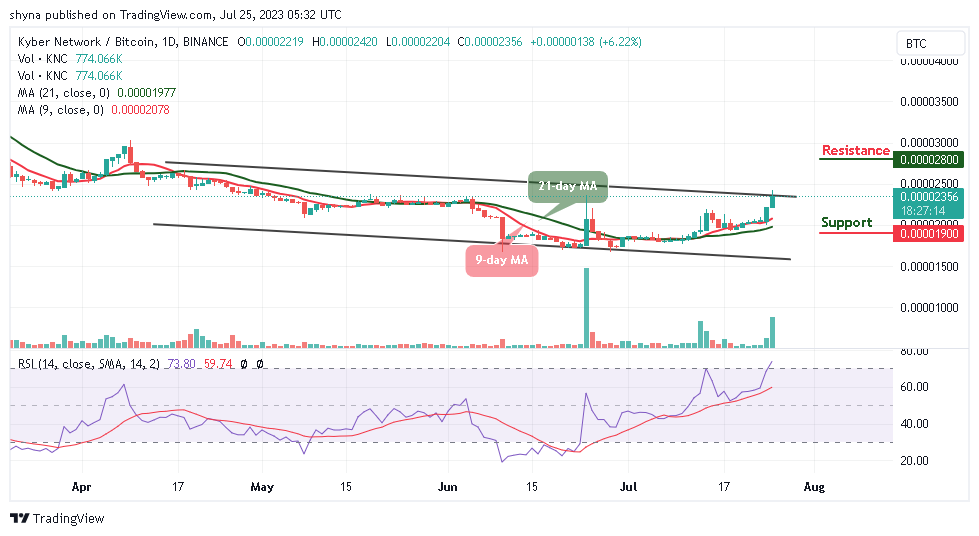
However, a bullish cross above the upper boundary of the channel may play out and the potential resistance level could be located at 2800 SAT and above as the technical indicator Relative Strength Index (14) crosses into the overbought region, giving a bullish signal.
Alternatives to Kyber Network
At the time of writing, the Kyber network price may continue to trend to the upside. As a result, a retracement could be probable before breaking the $0.75 level to the upside. However, the Kyber Network price will have to stay above the 9-day and 21-day moving averages in other to guide against the downward pressure.
Meanwhile, one of the exciting things about the Wall Street Memes project is its tokenomics. This means that the project could have more sustainable price action post-launch, as investors’ profits will vary. Moreover, WSM tokens are in presale, time is running out as almost $18 million has been raised so far.
New OKX Listing - Wall Street Memes

- Established Community of Stocks & Crypto Traders
- Featured on Cointelegraph, CoinMarketCap, Yahoo Finance
- Rated Best Crypto to Buy Now In Meme Coin Sector
- Team Behind OpenSea NFT Collection - Wall St Bulls
- Tweets Replied to by Elon Musk
Join Our Telegram channel to stay up to date on breaking news coverage