Join Our Telegram channel to stay up to date on breaking news coverage
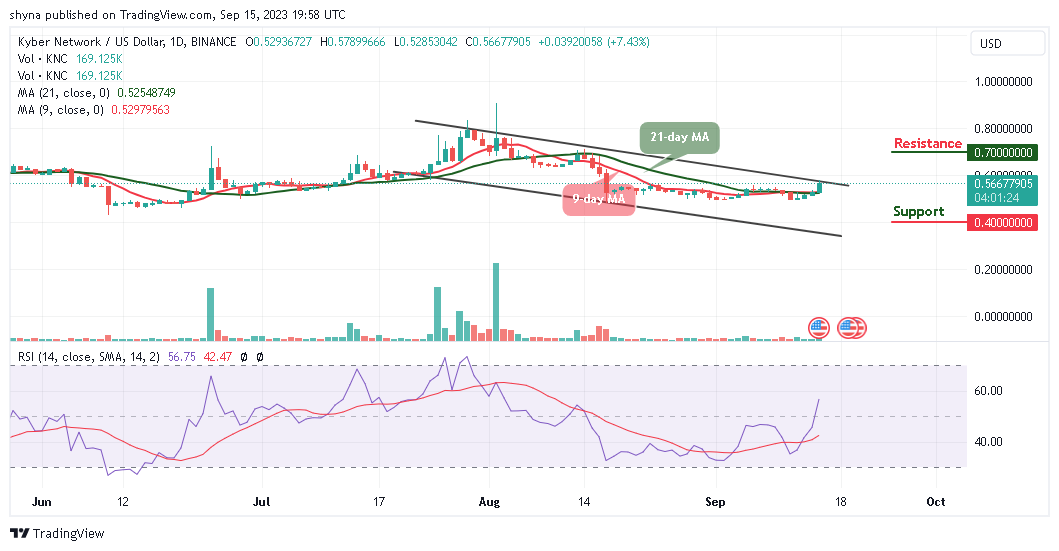
The Kyber Network price prediction shows that KNC could break above the upper boundary of the channel to hit the resistance level of $0.60 level.
Kyber Network Prediction Statistics Data:
- Kyber Network price now – $0.56
- Kyber Network market cap – $109.4 million
- Kyber Network circulating supply – 170.4 million
- Kyber Network total supply – 228.5 billion
- Kyber Network Coinmarketcap ranking – #188
KNC/USD Market
Key Levels:
Resistance levels: $0.70, $0.80, $0.90
Support levels: $0.40, $0.30, $0.20

KNC/USD is likely to cross above the upper boundary of the channel to reach the resistance level of $0.60. The coin is currently hovering at $0.56 with a bullish crossover and trend intraday. However, the bulls are dominating the market as all technical indicators face the upside, but higher support could be found at the $0.50 level.
Kyber Network Price Prediction: KNC Gets Ready to Explode
In the next positive move, the Kyber Network price may spike above the channel as the technical indicator Relative Strength Index (14) moves to cross above the 60-level, the coin may continue to experience some bullish signals which can encourage more buyers to enter the market.
Meanwhile, if the 9-day moving average crosses above the 21-day moving average, the coin may hit the nearest resistance at $0.60, before locating the potential resistance levels at $0.70, $0.80, and $0.90 respectively. Moreover, if the technical indicator decides to make a quick turn and face the downside, there may be a quick bearish drop, which may likely hit the support levels of $0.40, $0.30, and $0.20.
KNC/BTC Moves Bullishly
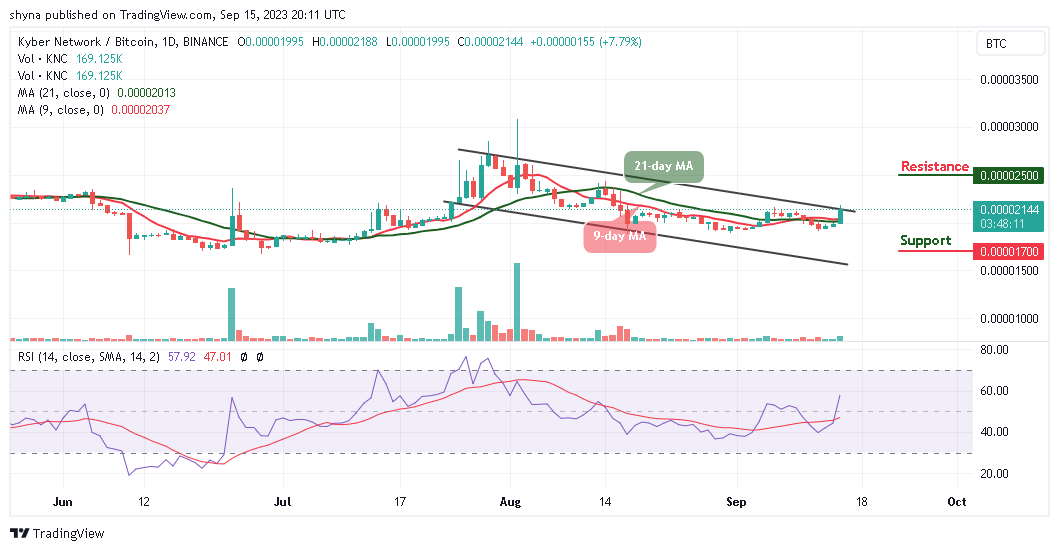
Against Bitcoin, Kyber Network price is hovering above the 9-day and 21-day moving averages as the price touches the resistance level of 2188 SAT. However, the fact that the market remains in the descending channel, seems to cross above the upper boundary of the channel.

Therefore, if the buyers push the market price above the channel, KNC/BTC may touch the resistance level of 2500 SAT and above. Meanwhile, if the sellers step back into the market, higher selling pressure may cancel the bullish pattern, and this could attract new sellers coming into the market with the next support level at 1700 SAT and below, but the technical indicator Relative Strength Index (14) moves to cross above the 60-level, suggesting bullish signals.
Kyber Network Alternatives
According to the daily chart, the next step for the Kyber Network price is to cross above the upper boundary of the channel. Once this is done, bulls could push the coin to hit the resistance level of $0.65. However, the more the bulls pressurized the bears, the higher the coin would reach.
Meanwhile, one of the exciting things about the Wall Street Memes is its official launch in the next few days. Investors, seize the moment! The token has surged to become one of the year’s biggest crypto sensations. With a massive and committed following, $WSM has impressively raised over $25 million during its presale, and it’s gearing up for a spectacular launch on multiple prestigious exchanges in the coming days.
New OKX Listing - Wall Street Memes
- Established Community of Stocks & Crypto Traders
- Featured on Cointelegraph, CoinMarketCap, Yahoo Finance
- Rated Best Crypto to Buy Now In Meme Coin Sector
- Team Behind OpenSea NFT Collection - Wall St Bulls
- Tweets Replied to by Elon Musk
Join Our Telegram channel to stay up to date on breaking news coverage


