Join Our Telegram channel to stay up to date on breaking news coverage
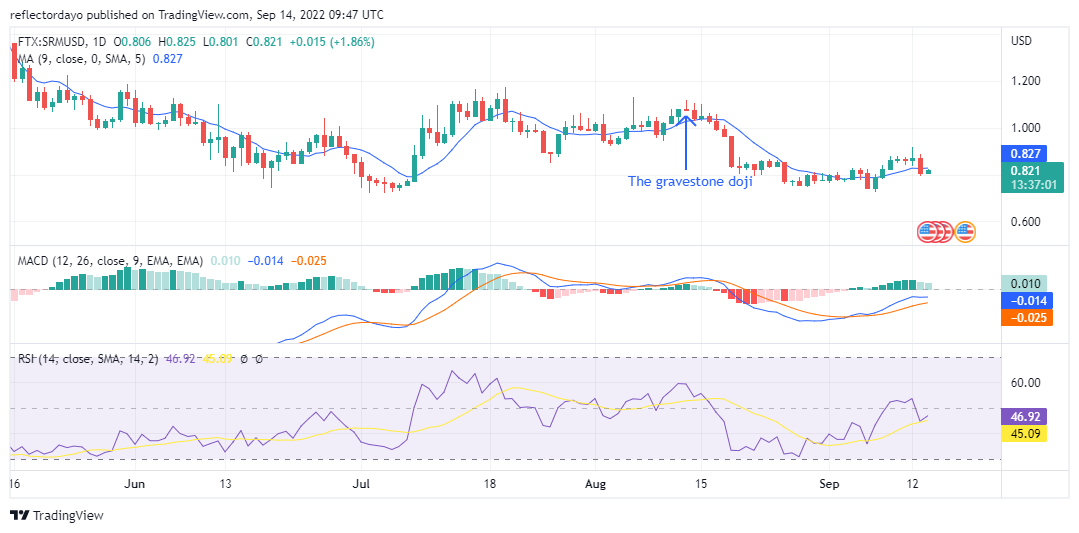
The gravestone doji that appear on the 13th of August suggested that a downtrend of SRM/USD was imminent. In confirmation of this, the price started falling on the following day (14th August). The price fell below the $1.00 support level and then find support at $0.827. Thereafter, the price kept ranging from then till today. On the 12th of September, buyers won control of the market, but due to strong buying pressure, they were unable to break free from the $0.871 price resistance level. Bears became strong enough on the following day to bring down the price to the $0.799 support level. From here the market starts trying to find an upward bearing
Serum Market Price Statistic:
- SRM/USD price now: $0.821
- SRM/USD market cap: $212,820,530
- SRM/USD circulating supply:263,244,669.00
- SRM/USD total supply:1,092,844,982
- SRM/USD coin market ranking: #132
Key Levels
- Resistance: $0.850, $0.900, $0.950
- Support: $0.791, $0.750, $0.700
Your capital is at risk
Serum Price Analysis: The Indicators’ Point of View
The Moving Average Convergence and Divergence indicator portrays the market already on the downside trying to recover to the upside. However, the momentum for recovery is reducing as the bears are facing off against the bulls. While MACD shows reducing bullish momentum, the RSI is showing a quick recovery from the downward performance of the line. RSI line is much quicker to reflect changes in the market. It is now measuring 47% of the market strength.
Serum: SRM/USD 4-Hour Chart Outlook
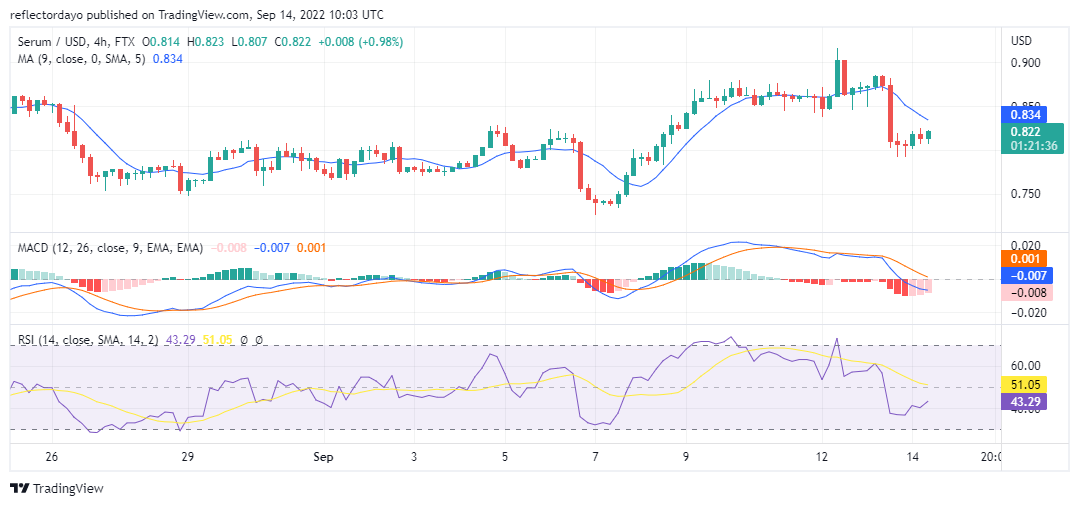
The first 4-hour session of today closed in favour of the buyers. The RSI quickly reflected an upward retracement of the line. It currently measures 43% of market strength in this timeframe. We can see that the price is on the downside trying to cross to the upside, but progress is very slow.
Related
Join Our Telegram channel to stay up to date on breaking news coverage
