Join Our Telegram channel to stay up to date on breaking news coverage
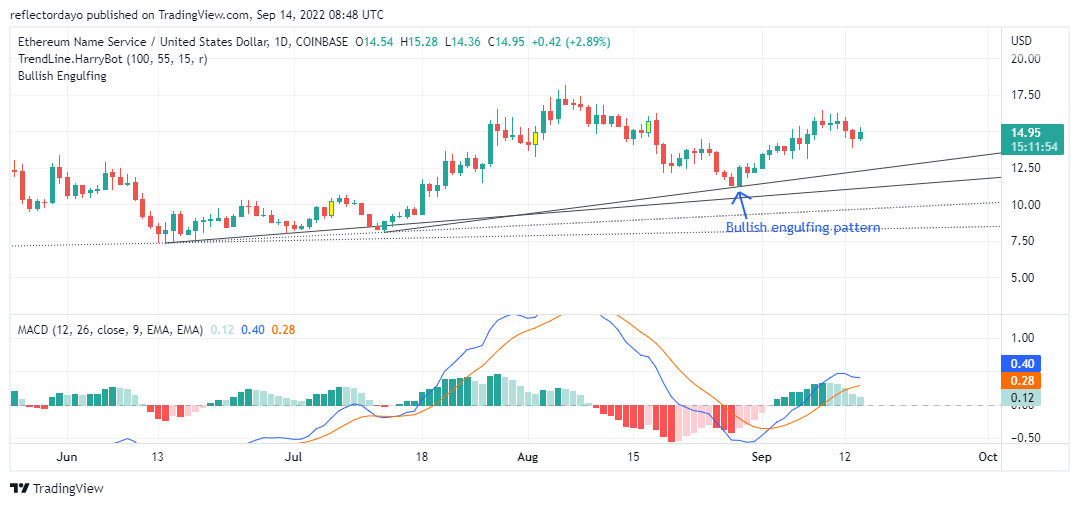
The bullish engulfing pattern candlestick of ENS/USD that was formed on the 29th of August signalled the price reversal to the upside. Since then, the price has been moving progressively to the upper price level. But along the line, strong selling pressure slows down the upward movement of the price. On the 12th and 13th of September, these days’ trading sessions closed in favour of the sellers. In today’s market, buyers are proving to be stronger than the sellers as they have taken the control of the market. At the same time, sellers are also very formidable in the market
Ethereum Name Service Market Price Statistic:
- ENS/USD price now: $14.97
- ENS/USD market cap: $301,815,823
- ENS/USD circulating supply: 20,244,862.09
- ENS/USD total supply: 100,000,000
- ENS/USD coin market ranking: #112
Key Levels
- Resistance: $16.00, $17.50, $18.64
- Support: $14.46, $13.70, $12.50
Your capital is at risk
Ethereum Name Service Price Analysis: The Indicators’ Point of View
If the price action did not continue its bullish trend, it may come down to the trendline and then bounces up from there as it has done previously. According to the MACD, the bullish strength began to reduce on the 10th of September. The bullish histogram began to show signs of weakness from then on. But as we see a bullish candle in today’s daily market session, it may be difficult to quickly see the progress of the bullish price recovery from the MACD (especially the histogram) in this timeframe. However, the MACD indicator will later confirm the bullish market of today’s market if the momentum continues.
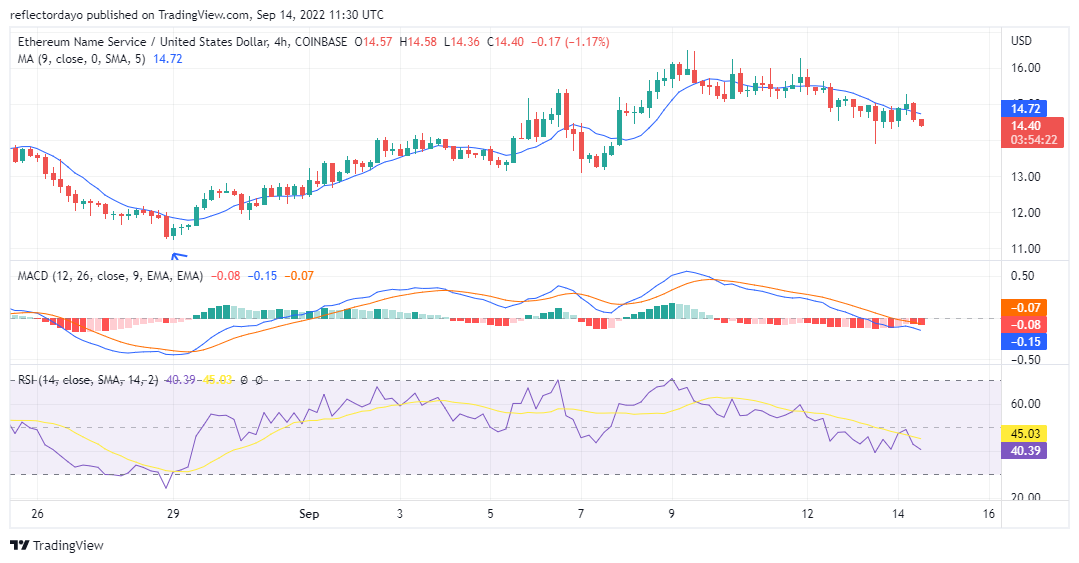
Ethereum Name Service: ENS/USD 4-Hour Chart Outlook
Unlike in the daily chart timeframe, where the two MACD line is on the positive side trying to move to the negative side, here the two lines are on the negative side, trying to move up to the positive side. The MACD histograms are showing bearish weakness. Bulls are trying to regain the market. The decreasing negative histograms are pinkish, which is a sign of bullish activities.
Related
Join Our Telegram channel to stay up to date on breaking news coverage