Join Our Telegram channel to stay up to date on breaking news coverage
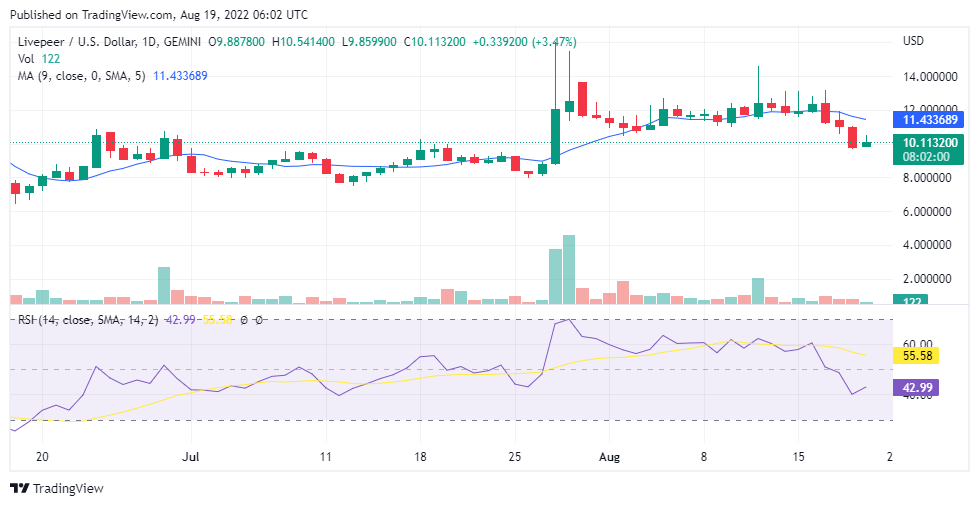
From 17th to 18th of August, aggressive selling pressure pervaded the LPT/USD market. Today we see the bulls trying to recover their ground in the market. They were strong enough to resist any further bearish moves. They have kept the market at around $10.0000. There is the possibility that the market may soon seek an upward retracement.
Livepeer Price Statistic Data:
- LPT/USD price now: $9.72
- LPT/USD market cap: $237,531,383
- LPT/USD circulating supply: 24,445,868LPT
- LPT/USD total supply: 25,866,594LPT
- LPT/USD coin market ranking: #126
Key Levels
- Resistance: $9.89123591, $12.49372717, $12.343541780
- Support: $9.63877186, $10.78816945, $8.22983288
Your capital is at risk
Livepeer Analysis: Information From the Indicators
Generally, both the demand and supply in the market are not strong. After the July 28th strong bullish move, the price consolidated at around $11.00000. The 9-day moving average, at some point, conformed to the movement of price action on the chart. But, from the 17th of August, bears gained enough strength to begin to push the price below the 9-day moving average. The Relative Strength Index line is retracing an upward position and now measures 42.99% which is an indication of a downtrend. The RSI signal line is also falling and has now reached 55.58%. There is the possibility that the price will soon rise because of today’s market behaviour.
Livepeer Analysis: LPT/USD 4-Hour Chart Point of View
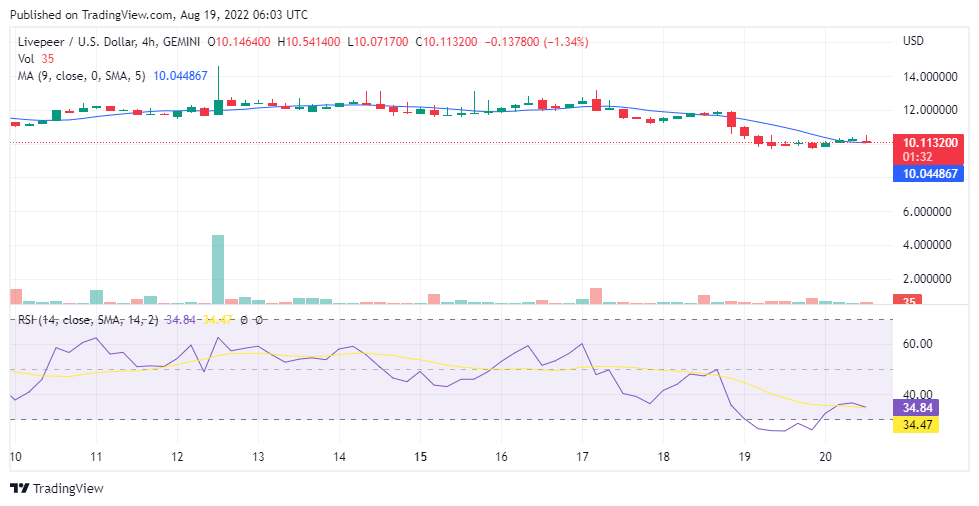
In the 4-hour chart of today, the first and second session was bullish. But in the third session, the bears took the market. The RSI line is going to the threshold of the oversold region. The signal line is not far, and both lines measure in almost compliance with each other. They both measures 34%. Once the price crosses the boundary, the price of the market will correct itself to an upper position.
Related
Join Our Telegram channel to stay up to date on breaking news coverage
