Join Our Telegram channel to stay up to date on breaking news coverage
Binance Coin Price Prediction – August 20
It currently portrays that the Binance Coin market valuation shifts downward, succumbing to a slight pressure imposed on it by the purchasing force of the US Dollar. There have been products of $240.11 and $336.28 as the low and high-value points in the last thirty days of operations. As of the time of this analytics write-up, price trades at $287.41 at an average of 2.87% positive.
Binance Coin Price Statistics:
BNB price now – $287.41
BNB market cap – $46.3 billion
BNB circulating supply – 161.3 million
BNB total supply – 161.3 million
Coinmarketcap ranking – #5
Binance Coin Market
Key Levels:
Resistance levels: $300, $325, $350
Support levels: $225, $200, $175 BNB /USD – Daily Chart
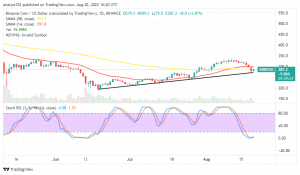
The daily chart reveals that the Binance Coin market shifts downward against the valuation of the US Dollar, briefly breaching past the trend lines of the SMAs to the south side in the process. The 14-day SMA indicator has placed at $297.80 tightly over the $293.90 value line of the 50-day SMA indicator. The bullish trend line drew northward to get at a psychological mark around $271.70, suggesting it to be where forces to the downside may tend to get weakened. The Stochastic Oscillators have penetrated the oversold region, showing the degree of falling at 4.58 and 1.53 range points within.
Your capital is at risk.
Will a further breakdown in the BNB/USD trade at $250 set in a new bearish cycle afterward?
A sustainable breakdown in the BNB/USD market operation at $250 may potentially pave new ways for nudging into a bearish trading cycle in another round as the crypto economy shifts downward from a peak point closely below the $350 resistance level. Long-position takers may begin to build up energy as there has been a slight formation of a bullish candlestick to get a decent buying order entry point.
On the downside of the technical analysis, it is unclear to get a profitable selling order than a buying order presently. A bullish candlestick is in the making to confirm the invalidation of re-launching of sell positions. However, if the candlestick turns out to be a bearish outlook type, the bullish trend may risk being breached furthermore in the south direction. Based on those assumptions, short-position placers have to put their shorting exercise on hold for a while.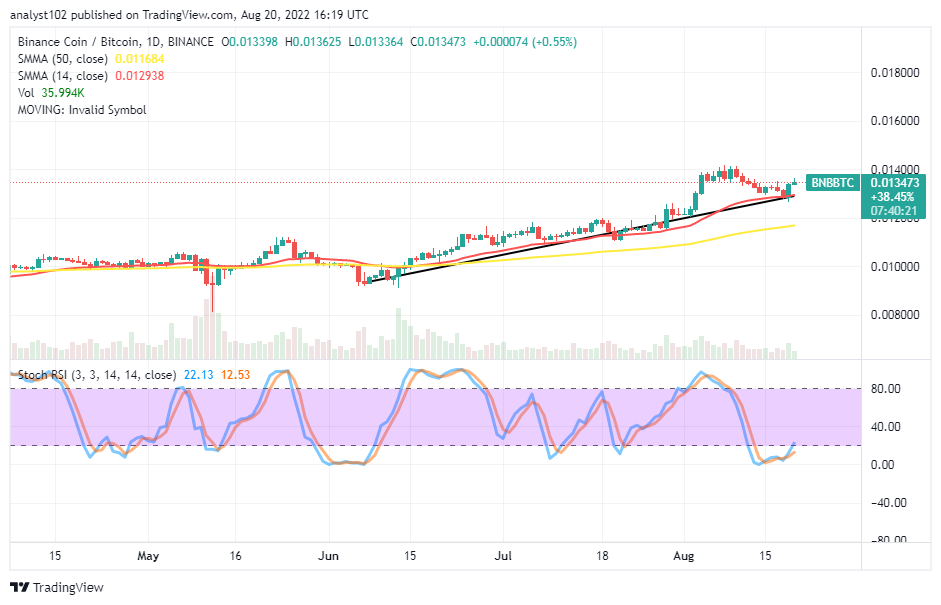
BNB/BTC Price Analysis
Binance Coin has been seemingly trying to push back against the trending ability of Bitcoin since yesterday’s sessions. In the recent past operations, the pairing trading crypto made a reversal motion to find support around the smaller SMA trend line. The 14-day SMA indicator is above the 50-day SMA indicator. The bullish trend line drew northward around the smaller SMA, marking the logical bottom points where the price has been finding support up to the upside direction. The Stochastic Oscillator has crossed northbound in the oversold region, pointing to the upside below the 20 range line.
Read more:
- How to buy Binance Coin
- How to buy cryptocurrency
Join Our Telegram channel to stay up to date on breaking news coverage