Join Our Telegram channel to stay up to date on breaking news coverage
Lucky Block Price Prediction – June 24
LBlock is in a downtrend as the cryptocurrency battles $0.001120 high. The coin has risen to a level of $0.001120. The breaking of the recent high will determine the recovery of the coin.
LBLOCK Price Statistics Data
LBLOCK price now – $0.001087
LBLOCK market cap – $44,264,611
LBLOCK circulating supply – 40.77B LBLOCK
LBLOCK total supply – $108,735,273
LBLOCK Coinmarketcap ranking – #4549
Key Levels:
Resistance levels: $0.0016, $0.0018, $0.0020
Support levels: $0.0014, $0.0012, $0.0010
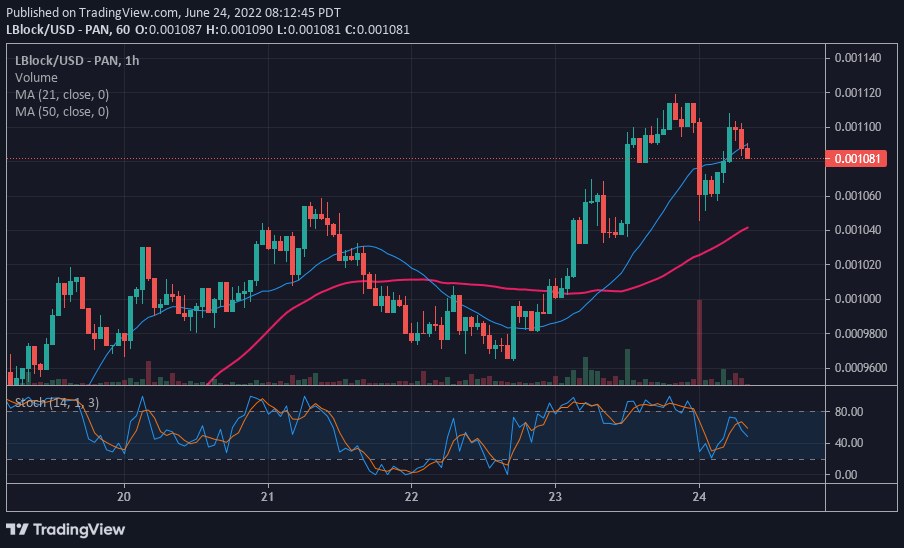
LBLOCK/USD Medium-term Trend: Bearish (1-hour chart) – Battles $0.001120 High
On June 23, LBlock/USD made an upward move as the coin reached the high of $0.001120. The bulls retested the recent high twice before the recent breakdown. The cryptocurrency face stiff resistance at the recent high and plunged below the 21-day line SMA. Immediately, the bulls bought the dips and pulled prices above the moving average. The second uptrend was short-lived as the bears pushed the coin below the 21-day line SMA. LBlock price is now between the 21-day line SMA and the 50-day line SMA. The coin is likely to be range-bound between the moving averages. The uptrend will resume if price breaks above the 21-day line SMA. The selling pressure will resume if price breaks below the 50-day line SMA.
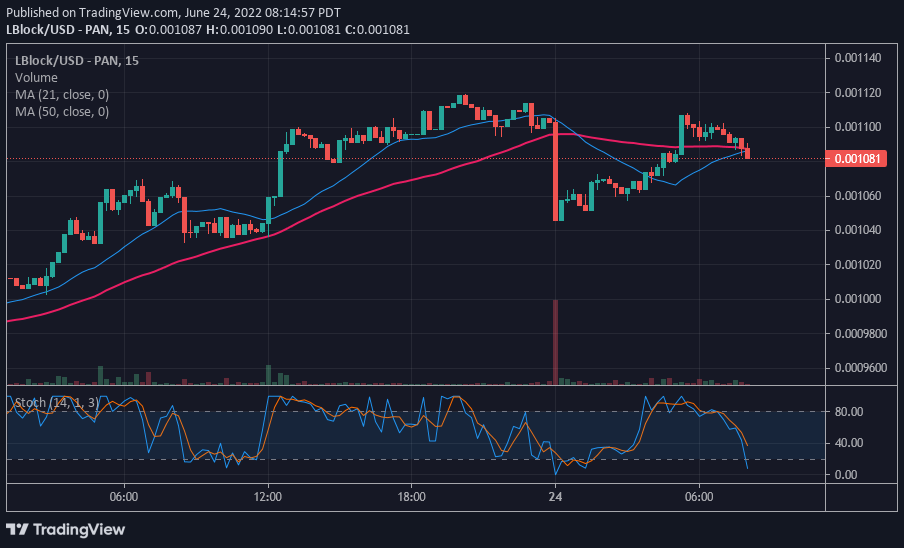
LBLOCK/USD Medium-term Trend: Bearish (15-Minute Chart)
LBlock price has broken above the moving averages as it battles $0.001120 high. The cryptocurrency has fallen to the oversold region of the market. Therefore, the selling pressure is likely to subside as buyers emerged in the oversold region.

Join Our Telegram channel to stay up to date on breaking news coverage


