Join Our Telegram channel to stay up to date on breaking news coverage
Lucky Block Price Prediction – June 16
LBlock/USD is in a downtrend as it rebounds above level $0.001012 . The crypto’s selling pressure has subsided after June 13 price slump. On June 13, LBlock finds support above $0.0007722 as the altcoin made an upward correction. Today, the cryptocurrency is trading at $0.001022 at the time of writing.
LBLOCK Price Statistics Data
LBLOCK price now – $0.001053
LBLOCK market cap – $42,794,532
LBLOCK circulating supply – 40.77B LBLOCK
LBLOCK total supply – $105,300,064
LBLOCK Coinmarketcap ranking – #3682
Key Levels:
Resistance levels: $0.0016, $0.0018, $0.0020
Support levels: $0.0014, $0.0012, $0.0010
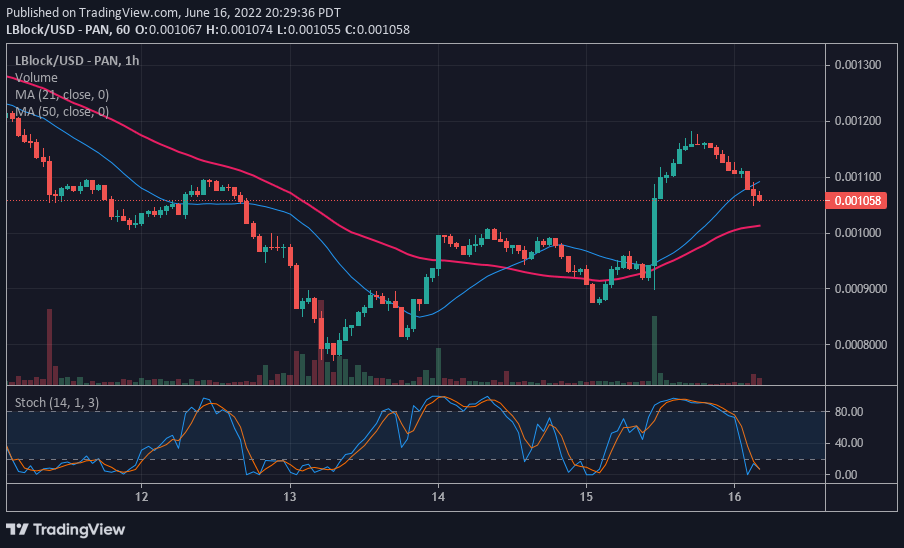
LBLOCK/USD Medium-term Trend: Bearish (1-hour chart) – It Rebounds Above Level $0.001012
Presently, the crypto is retracing after rejection from the $0.001200 resistance zone. LBlock price broke below the 21-day line SMA but it is above the 50-day line SMA. The coin will be compelled to a range-bound move if it finds support above the 50-day line SMA. On the downside, the selling pressure will be continue if price breaks below the moving averages. The downtrend is likely to be accelerated. In the meantime, the coin is holding above the 50-day line SMA. Further upward movement of the altcoin is likely.
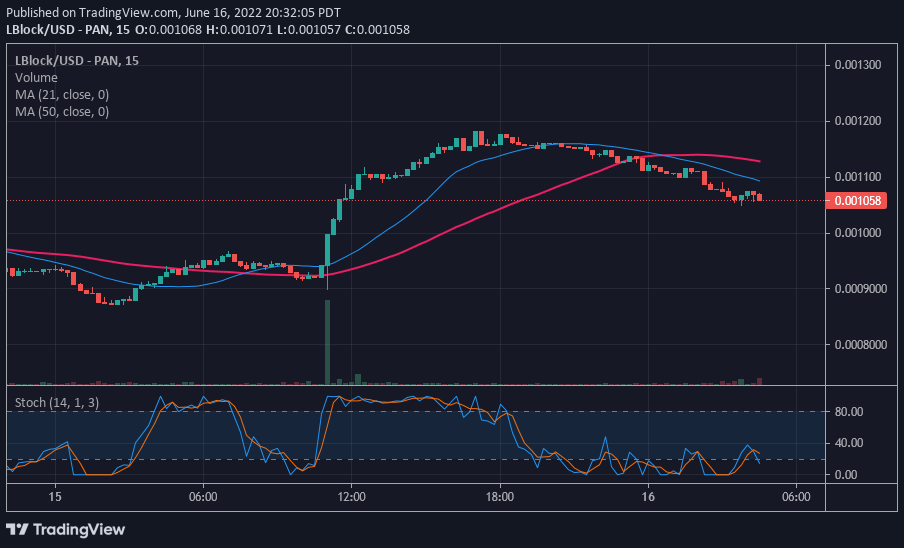
LBLOCK/USD Medium-term Trend: Bearish (15-Minute Chart)
LBlock/USD is trading in the bearish trend zone as it rebounds above level $0.001012. LBlock is making an upward correction to the previous highs. The coin will resume trending when price breaks above the moving averages.

Join Our Telegram channel to stay up to date on breaking news coverage


