Join Our Telegram channel to stay up to date on breaking news coverage
The Bitcoin price prediction reveals that BTC continues to head to the downside as its price moves below $22,500 to touch the low of $20,464.
Bitcoin Prediction Statistics Data:
- Bitcoin price now – $20,807
- Bitcoin market cap – $397.7 billion
- Bitcoin circulating supply – 19.0 million
- Bitcoin total supply – 19.0 million
- Bitcoin Coinmarketcap ranking – #1
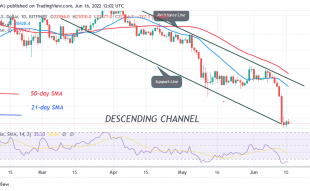
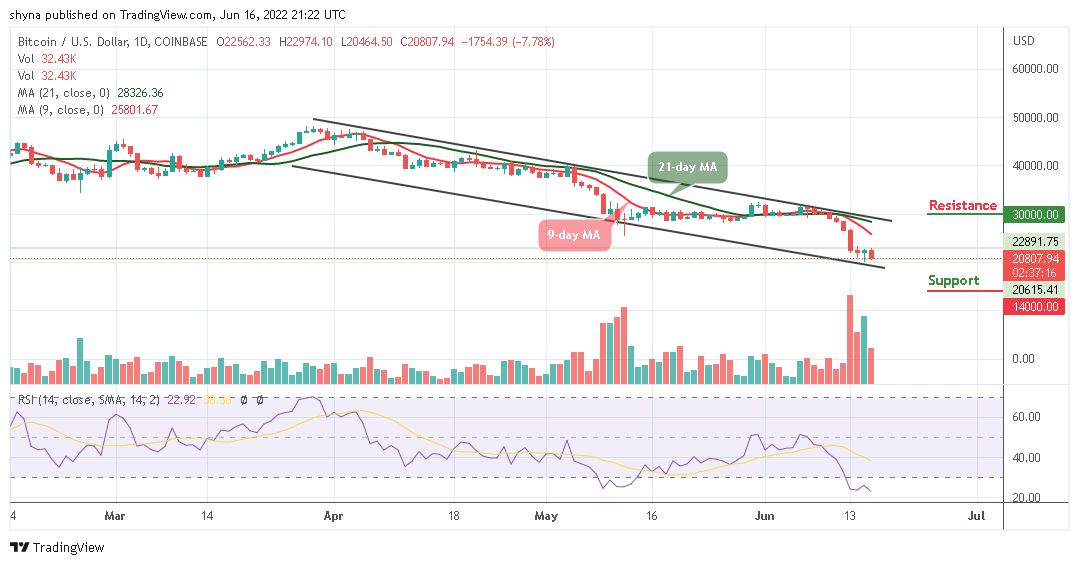
BTC/USD Long-term Trend: Bearish (Daily Chart)
Key levels:
Resistance Levels: $30,000, $32,000, $34,000
Support Levels: $14,000, $12,000, $10,000
BTC/USD is trading around $20,807 below the 9-day and 21-day moving averages. Looking at the daily chart, Bitcoin (BTC) has remained in a bearish zone, and it is likely to continue lower below the support of $20,000. However, the king coin is now plunging below the former resistance level of $22,000 which may cause many investors to take profits off the table.
Bitcoin Price Prediction: Would Bitcoin (BTC) Break More Downs?
The Bitcoin price is currently changing hands at $20,807, however, where BTC trends next may partly depend on whether or not buyers can close today’s candle above the $20,000 level. Should in case this comes to play, the bulls may propel prices higher, and then traders may expect the king coin to rise above the $25,000 resistance, which could later move towards the potential resistance levels at $30,000, $32,000, and $34,000.
On the other hand, if the Bitcoin price failed to close above the $22,000 resistance level; the price could drop below the lower boundary of the channel. A further low drive could send the price to $14,000, $12,000, and $10,000 supports. Meanwhile, the technical indicator Relative Strength Index (14) has recently revealed a sign of trend reversal as the signal line shows a possible bearish momentum within the clients.
BTC/USD Medium-Term Trend: Bearish (4H Chart)
Looking at the hourly chart, following the rejection of $21,012, BTC/USD is trading below the 9-day and 21-day moving averages. Looking at it from above, if the Bitcoin holds above $22,000, then the next level of resistance could be $23,000, along with the significant mentioned ascending trend-line. The next resistance could be $24,000 and above.
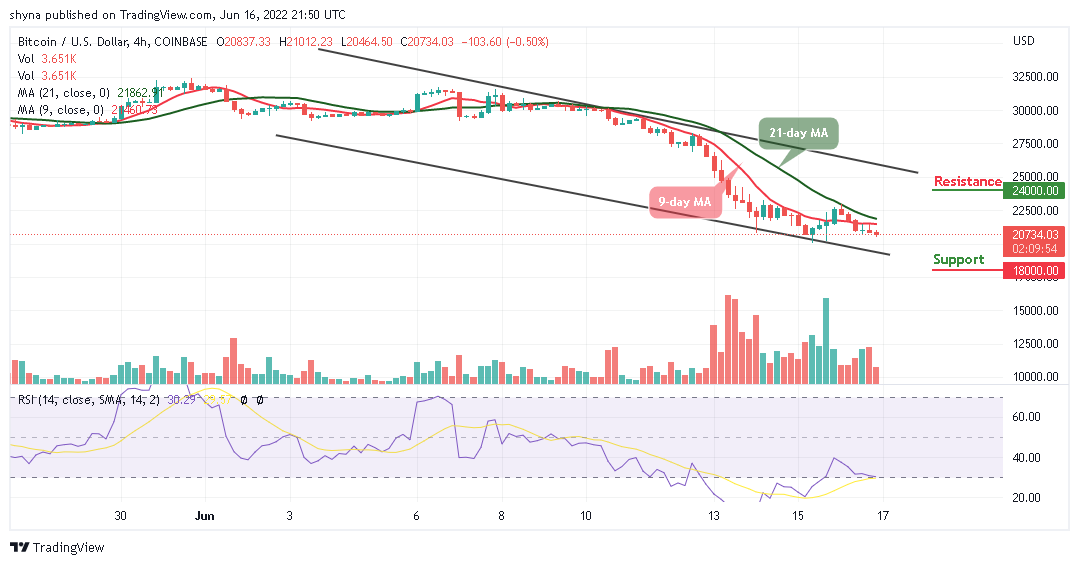
Meanwhile, as the technical indicator remains below, this might have signaled a temporary end to the bullish trend of Bitcoin for a moment. However, if the coin falls below the lower boundary of the channel, the market price may likely reach the support levels of $18,000 and below.
Read more:
- How to buy Bitcoin
- How to buy Cryptocurrency
Join Our Telegram channel to stay up to date on breaking news coverage