Join Our Telegram channel to stay up to date on breaking news coverage
BCH Price Prediction – July 14
BCH/USD looks to drop below 21-day moving average to test $225 support level
BCH/USD Market
Key Levels:
Resistance levels: $245, $265, $285
Support levels: $215, $195, $175

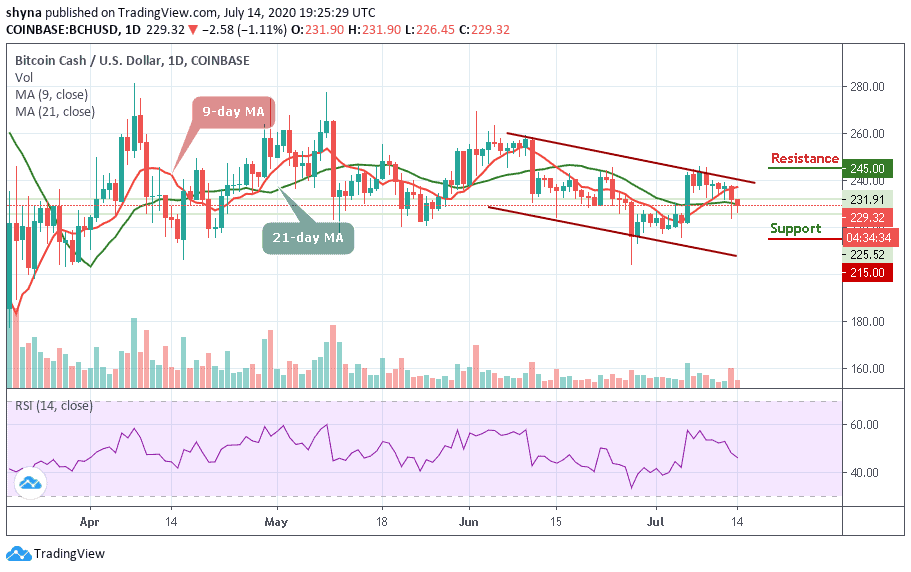
Since the beginning of this week, most of the major currencies in the crypto market have suffered losses for some time. Likewise, BCH/USD continues to drop as it is currently trading at $229.32. The price trend of BCH coin is having more inversely trading red candles leading to loss-making investments.
Meanwhile, looking at the daily movement of BCH/USD over the past 8 days, we see that the coin started the month at $221, after which it constantly posted two highest highs. The BCH/USD could not maintain volatility; the downward trend led the currency to $225, down 1.11% from the monthly high of $245.
However, BCH/USD is currently changing hands at $229.32 and if the market price continues to fall, the coin could fall to the support levels of $215, $195, and $175, as the RSI (14) is below the 48-level. Meanwhile, strong buying pressure can push the price to the resistance level of $235. When trading at $240, a bullish chase may hit the resistance levels of $245, $265, and $285.
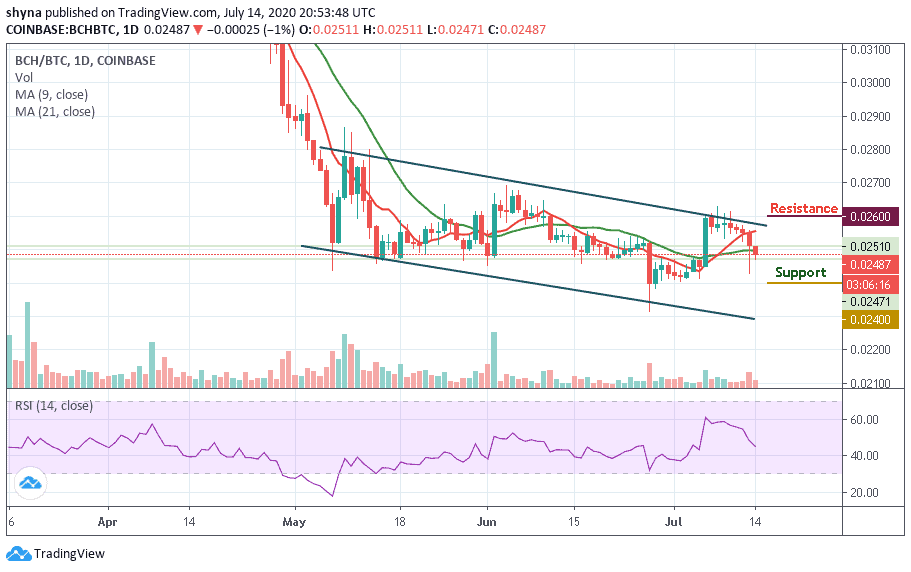
Against Bitcoin, Bitcoin Cash is being weak due to a recurring bearish feeling which caused a drastic fall in the market. As the price drops, sellers pose an additional threat to buyers to reach the support level of 0.0247 BTC, where the closest target is located. However, a possible break under the bottom of the channel can cause the coin to collapse.

For an upward movement, 0.0250 BTC is currently the main resistance level. Therefore, a negative peak could retest the major support at BTC 0.0240 and below. The trading volume is falling while the RSI (14) moves toward the 40-level, suggesting more bearish signs.
Join Our Telegram channel to stay up to date on breaking news coverage

