Join Our Telegram channel to stay up to date on breaking news coverage
Bitcoin (BTC) Price Prediction – July 14
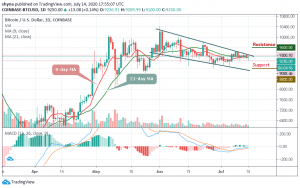
The daily chart reveals that the Bitcoin bulls may be growing stronger as the coin is been haunted by the range.
BTC/USD Long-term Trend: Ranging (Daily Chart)
Key levels:
Resistance Levels: $9,600, $9,800, $10,000
Support Levels: $8,800, $8, 600, $8,400

BTC/USDis seen moving in a narrow range, but chances are that the Bitcoin price could break above the $9,464 of July 8 if the bulls put more pressure on the coin to revisit $9,500 – $9,800 resistance level. At the moment, the first digital coin is changing hands at $9,250. However, the Bitcoin (BTC) is been locked in a tight range for some weeks with rare attempts to break free in any of the directions.
Nevertheless, if the bulls could break above the $9,200 and $9,300 resistances, the market price may accelerate to retest the $9,400 overhead resistance but a breakout around the upside is expected as the bulls have tested the resistance on several times. In other words, if the $9,000 support fails to hold, BTC could drop sharply to $8,800, $8,600, and $8,400 low because the $9,000 support has been tested several times.
Meanwhile, the market is still consolidating above $9,200. Looking at it technically, the bulls may overcome the bears in the long run as the technical indicator MACD signal lines are making an attempt to cross into the positive side. Before that, BTC/USD is still trading sideways and below the 9-day moving average.
BTC/USD Medium – Term Trend: Ranging (4H Chart)
On a 4-hour chart, BTC/USD is doing well today but traders are expecting the coin to gain momentum and trade above $9,500. As volatility fluctuates, selling pressure still exists, causing the coin to lose the most support below the moving averages.
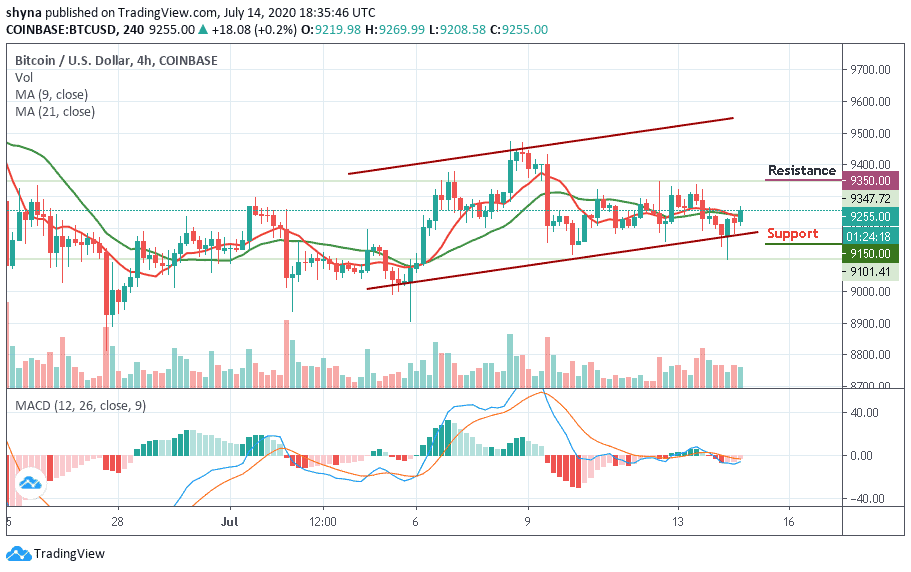
Meanwhile, $9,150 or below can come into play if BTC/USD falls below the channel. However, if buyers can put more effort, they can still push the market price above the moving averages. Therefore, breaking above this barrier could also allow the bulls to hit the potential resistance at $9,350 and beyond. In addition, the coin may remain around the downside if the MACD signal lines are on the negative side.
Join Our Telegram channel to stay up to date on breaking news coverage