Join Our Telegram channel to stay up to date on breaking news coverage
Zcash (ZEC) Price Prediction – August 7
Over time, it has now been that the Zcash market gathers catalysts to surge higher, trading against the worth of the US Dollar. Crypto has had an all-time high of $5,941.80 in the last six years ago and an all-time low of $18.94 about two years ago on its financial book of record. As of writing, the price trades around $71 at an average percentage rate of 5.11 positives.
Zcash (ZEC) Price Statistics:
ZEC price now – $71.02
ZEC market cap -$1.1 billion
ZEC circulating supply – 15 million
ZEC total supply – 15 million
Coinmarketcap ranking – #51
ZEC/USD Market
Key Levels:
Resistance levels: $80, $90, $100
Support levels: $60, $50, $40
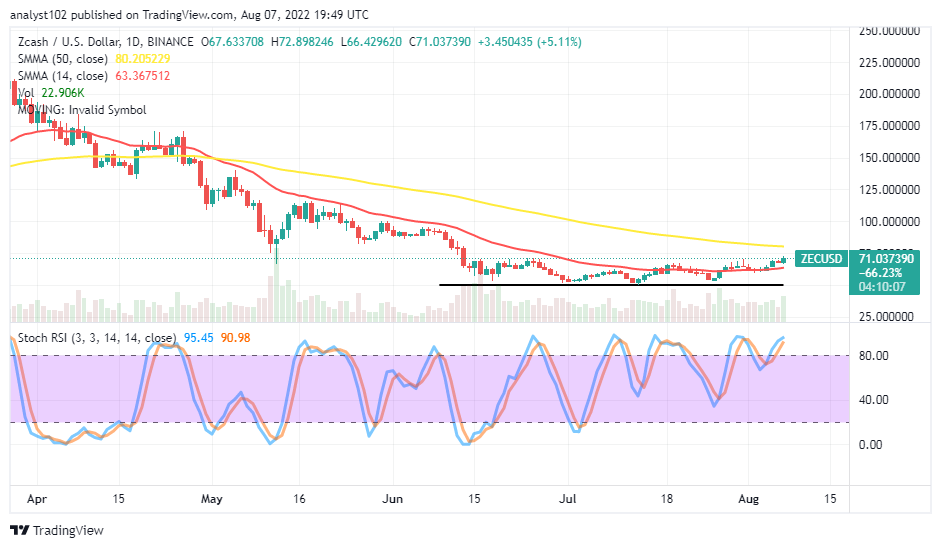
The daily chart reveals the crypto market gathers catalysts to surge higher. The horizontal line drew at the $50 support level, marking the bottoming area where variant candlesticks had had a sit to form a baseline from which price has swung northward. The 14-day SMA trend line is at $63.367512 below the value line of the 50-day SMA trend line, which is at $80.205229. The Stochastic Oscillators are in the overbought region, pointing to the upside direction to denote the market is in progressive forces.
Will the ZEC/USD market push further to touch the 50-day SMA at an $80.205229 resistance point?
If the ZEC/USD market bulls build firmly upon the current trending force to the upside, the price may systemically extend to the point of the 50-day SMA at $80.205229 resistance as the gathers catalysts to surge higher. As it is, it may be a good time for long-term investors to start looking in the direction of this trade by joining or increasing their portfolio size. Traders are warned not to over-leverage their accounts.
On the downside of the technical, the ZEC/USD market bears have to be patient until a bearish candlestick emerges at a higher-resistance trading spot before re-considering a launching of sell order afterward. Short-position takers may have to wait for convergence of price actions around the trend line of the 50-day SMA to observe what the market may eventually be doing toward a particular direction for traders to follow up immediately.
ZEC/BTC Price Analysis
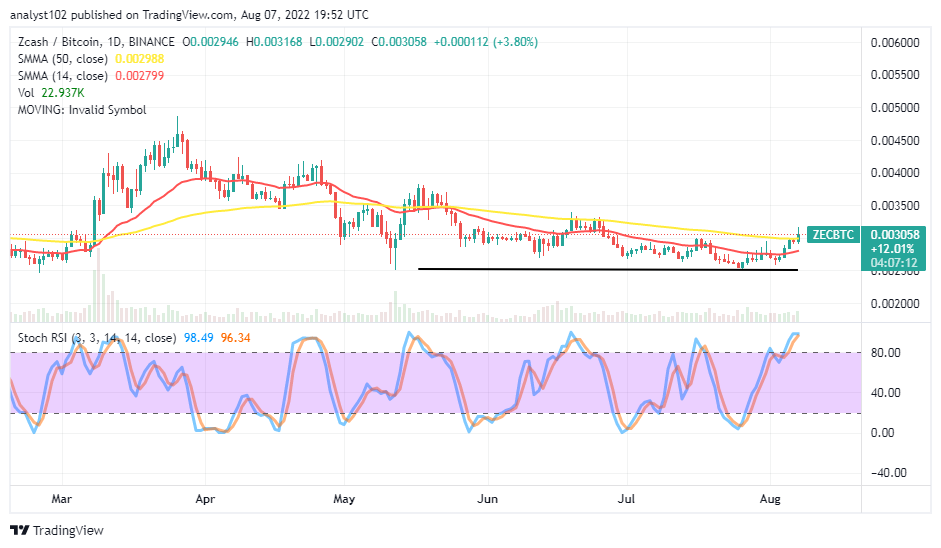
Zcash’s trending capacity compared with Bitcoin has been striving to push northward against the trend lines of the SMAs. The cryptocurrency pair price gathers catalysts to surge higher through resistance around the bigger SMA. The 14-day SMA indicator is underneath the 50-day SMA indicator. The Stochastic Oscillators are in the overbought region, somewhat trying to close the lines. That portends the base crypto may soon be relaxing in its efforts to push further against its flagship counter=trading crypto.
Read more:
Join Our Telegram channel to stay up to date on breaking news coverage


