Join Our Telegram channel to stay up to date on breaking news coverage
XRP Price Prediction – April 14
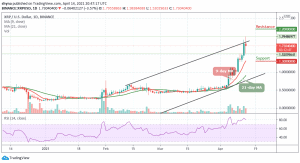
The Ripple price technical picture is healthy but a rising wedge pattern could force a free-fall to $1.50.
XRP/USD Market
Key Levels:
Resistance levels: $2.20, $2.30, $2.40
Support levels: $1.30, $1.20, $1.10

XRP/USD impressively cleared the resistance at $1.90. The surge followed stability and brief consolidation above the $1.95 level. On the other hand, XRP/USD is trading at $1.73 at the time of writing as the coin is losing 3.57% on the day. Meanwhile, the surge above $1.95 hit a wall at $1.98, giving way to selling pressure which forced the price back under $1.80.
Where is Ripple Price Going Next?
As XRP/USD is currently changing hands at $1.730, any attempt to make it cross below the 9-day and 21-day moving averages within the channel may open the doors for more downsides, trading towards the moving averages could spike below the $1.50 support level before creating a new bullish trend at the resistance levels of $2.20, $2.30, and $2.40.
However, traders may experience a quick buy once the trade reaches the resistance at the $2.0 level. And if the price fails to rebound, a bearish breakout is likely to trigger more selling opportunities for traders, which might cause the price to retest $1.52 and could further drop to $1.30, $1.20, and $1.10 support levels respectively. The RSI (14) is still moving within the overbought region.
When compares with Bitcoin, XRP price is trading within the channel and moving above the 9-day and 21-day moving averages. Meanwhile, the buyers are still making an effort to push the price above the upper boundary of the channel and the bullish continuation may bring it to the resistance levels of 3300 SAT and 3500 SAT respectively.

In other words, any bearish movement may likely drag the market towards the south, a possible fall could bring the market to the support levels of 2300 SAT and 2100 SAT. But according to the technical indicator RSI (14), the signal line is moving above 80-level within the overbought region, which suggests that more bullish movement may come to play.
Join Our Telegram channel to stay up to date on breaking news coverage