

Join Our Telegram channel to stay up to date on breaking news coverage
XRP Price Prediction – September 7
The Ripple (XRP) is now consolidating in an intraday zone between the daily low of $0.230 and a daily high of $0.243.
XRP/USD Market
Key Levels:
Resistance levels: $0.27, $0.28, $0.29
Support levels: $0.21, $0.20, $0.19
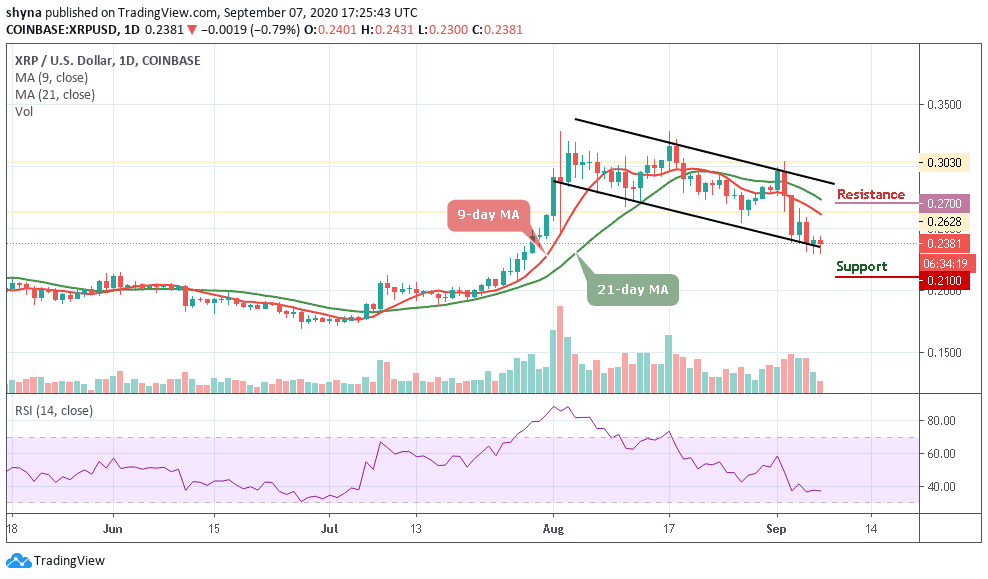
XRP/USD continues to consolidate its position below the $0.24 level. At the time of writing, the coin is floating towards the lower limit of the channel as the technical indicator RSI (14) is seen moving below 40-level. The daily breakdown shows that the intraday support and resistance lie between $0.230 and $0.243 respectively.
Would Ripple (XRP) Go Up or Down?
The fourth largest-cryptocurrency is witnessing a bearish drive against the USD, currently trading at $0.238. Therefore, since XRP/USD is following a sideways movement on a short-term outlook as it has been revealed by the technical indicator, traders may expect the trend to break below the lower boundary of the channel if the price actions remain below 40-level.
However, a channel breakdown could strengthen the bears and this could push the price to the support levels of $0.21, $0.20, and $0.19, or a channel breakout might lead the market in a bullish scenario if the price follows the upward trend and cross above the 9-day moving average to hit the nearest resistance at $0.27, $0.28, and $0.29 levels. For now, the coin may likely remain on the negative side as the green-line of 21-day MA is above the red-line of 9-day MA.
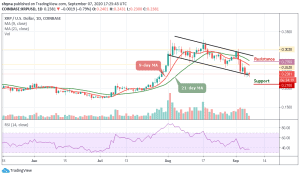
When compares with Bitcoin, the Ripple price is consolidating within the symmetric triangle, trading below the 9-day and 21-day moving averages. However, if the bulls could energize and push the price above the moving averages to cross the upper boundary of the channel, the coin may likely hit the resistance levels of 2600 SAT and 2700 SAT respectively.

On the other hand, if the bulls fail to halt the selling pressure and allow the coin to drop below the channel, XRP/BTC may follow the downward trend and the nearest support level is located at 2100 SAT and 2000 SAT respectively. More so, the RSI (14) seems to be giving a positive direction as the signal line is moving around 430-level, suggesting an upward trend for the coin.
Join Our Telegram channel to stay up to date on breaking news coverage
