

Join Our Telegram channel to stay up to date on breaking news coverage
XRP Price Prediction – April 11
The Ripple price is seen trading in the positive territory with gains of over 2.0% but can XRP price break $2 resistance?
XRP/USD Market
Key Levels:
Resistance levels: $1.65, $1.75, $1.85
Support levels: $1.15, $1.05, $0.95
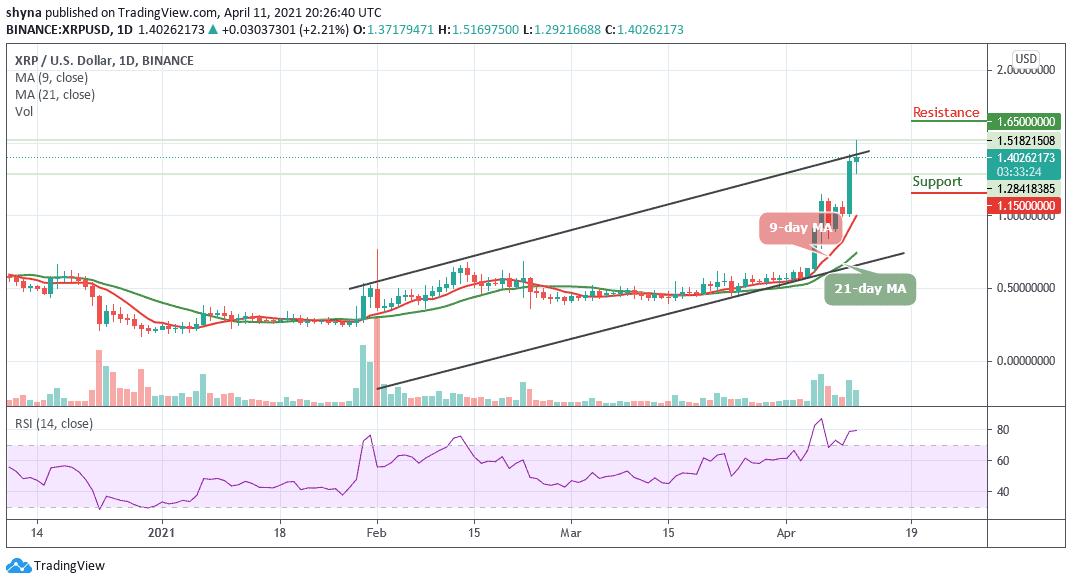
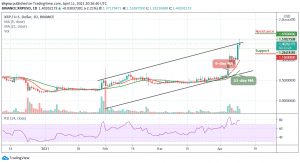
XRP/USD price is facing massive trend channel resistance as the coin prints another 2021 high at $1.51. While the coin has retreated to $1.40 at the time of writing, the pair retains bullish momentum. In the short term, XRP/USD has gained more than 2% in the last 24 hours. The bulls needed a daily break and closure above $1.80 to invite greater buying momentum.
Where is XRP Price Going Next?
Currently, the price of the coin is changing hands at $1.402 level and the bulls are still pushing the price towards the north. In other words, if the price moves toward the south and breaks below the 9-day and 21-day moving averages within the channel; the price could be pushed to the support levels of $1.15, $1.05, and $0.95.
However, the technical indicator RSI (14) is moving within the overbought zone which confirms that the bullish trend may take the coin to the nearest resistance level of $1.60, further resistance could be found at $1.65, $1.75, and $1.85 levels before the market is free to make another attempt at $2 level.
Against BTC, Ripple (XRP) is demonstrating some positive signs across the market. The trend is perpetually looking bullish in the long-term which is yet to cross the upper boundary of the descending channel. It is currently changing hands at 2333 SAT after witnessing some bearish movement today.
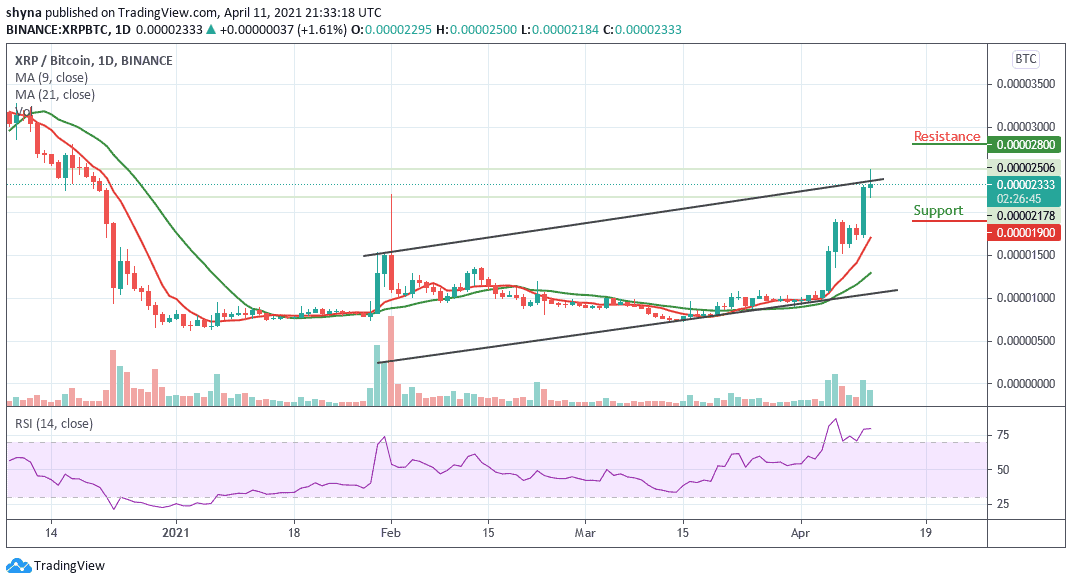
The resistance levels to look for are 2800 SAT, 3000 SAT and 3200 SAT while the closest support levels to keep an eye on are 1900 SAT, 1800 SAT, and critically 1700 SAT. The technical indicator RSI (14) is moving within the overbought region, which may continue to give more bullish signals.
Join Our Telegram channel to stay up to date on breaking news coverage
