Join Our Telegram channel to stay up to date on breaking news coverage
ETH Price Prediction – April 11
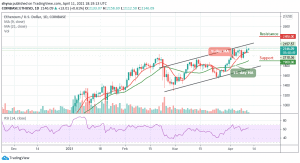
ETH/USD is still struggling to stay above $2200 as the entire market takes a brief pause.
ETH/USD Market
Key Levels:
Resistance levels: $2400, $2500, $2600
Support levels: $1900, $1800, $1700

ETH/USD is currently recovering above $2100 and it is likely to climb back above $2150 soon. Ethereum has remained relatively flat as the bulls and bears are struggling for the $2100 level. Meanwhile, the yearly high remains at $2158.69 with the nearest support level located at $2112.58 in the short term.
What is the Next Direction for Ethereum?
As ETH/USD keeps hovering above the 9-day and 21-day moving averages and if the price breaks above the upper boundary of the channel, it could test the potential resistance at $2200. However, a successful break above the channel could open the doors for an additional increase above the $2300 level. In the mentioned case, the price is likely to rise towards the $2400, $2500, and $2600 resistance levels in the coming sessions.
More so, as the technical indicator RSI (14) moves above the 60-level, which causes the market to remain at the upside but breaking below this level, may cause the coin to hit the nearest support at the $2000 level. If there is a bearish break below the 21-day moving average, ETH/USD could test the critical support at $1900, and any further bearish movement could lead to the support levels of $1800 and $1700 respectively.
When compares with Bitcoin, the Ethereum price is seen struggling above the 9-day and 21-day moving averages as the market keeps moving sideways; approaching the 0.036 BTC resistance level. Meanwhile, the 4-hours technical indicator RSI (14) is moving above 60-level, a slight bullish confirmation.

However, if the price breaks the important 0.036 BTC level, the bulls might push the market back to the 0.038 BTC. Therefore, if a breakout occurs above the upper boundary of the channel, traders may expect an immediate resistance at 0.039 BTC and above. Meanwhile, below the channel, the key support level could be located at 0.033 BTC and below.
Join Our Telegram channel to stay up to date on breaking news coverage