Join Our Telegram channel to stay up to date on breaking news coverage
XRP Price Prediction – April 7
XRP/USD is currently correcting higher, but the price remains sell on rallies near $0.80.
XRP/USD Market
Key Levels:
Resistance levels: $1.25, $1.30, $1.35
Support levels: $0.75, $0.70, $0.65
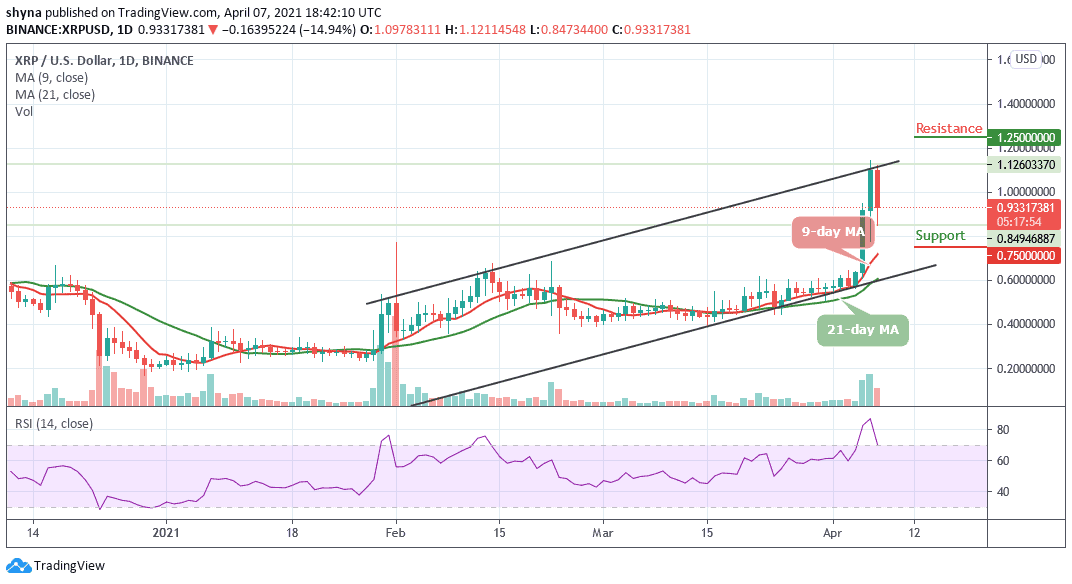
XRP/USD is currently having a massive drop towards $0.80 after losing the crucial support level of $0.90. However, the bulls are now having a hard time finding support as they move up was simply too steep. XRP/USD has nearly lost all the gains made since 3 days ago but the bulls could attempt to see a bounce in the next positive movement.
What to Expect from Ripple (XRP)
If the Ripple price drops below the $0.85 support level, the pair is likely to locate the $0.80 support, which is the close support level for the bears. A bearish continuation could then bring the market to the critical supports below the 9-day and 21-day moving averages at $0.75, $0.70, and $0.65 respectively.
On the contrary, should the bulls resume an upward trend, the price may likely break out of the channel to hit the potential resistance levels at $1.25, $1.30, and $1.35. Meanwhile, the technical indicator RSI (14) nosedives below 80-level within the overbought zone. If the price oscillates downward, XRP may continue to fall.
Against Bitcoin, the decline has continued and all support at the 1800 SAT has broken down. The price is set to test 1500 SAT if Bitcoin’s gains continue to impact the XRP price. The bearish scenario remained dominant within the channel as the sellers continued to put pressure on the market.
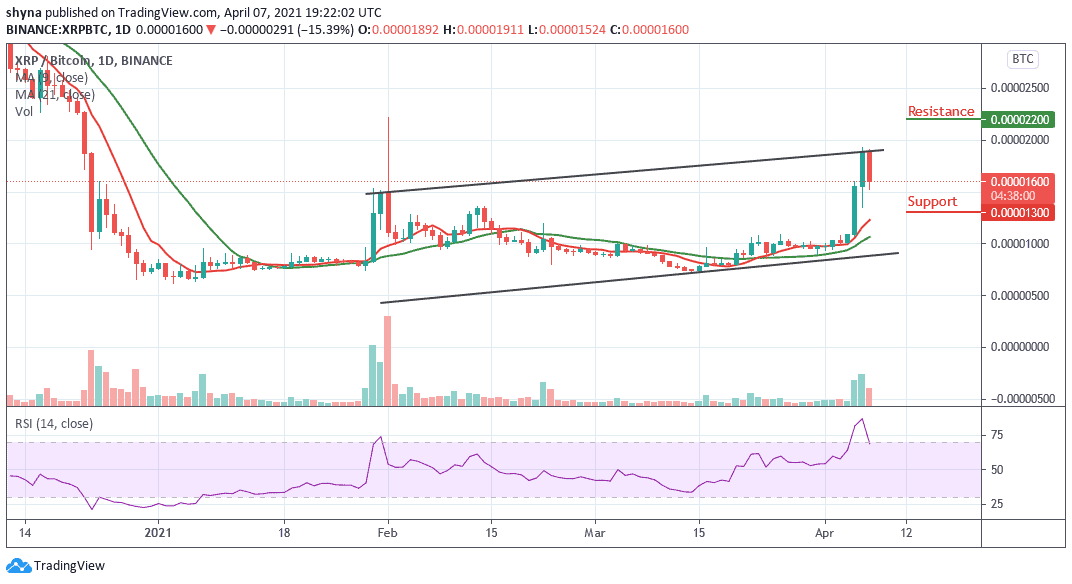
However, if the sellers occupy their positions, the Ripple price may drop to the support level of 1300 SAT and below. At present, the technical indicator RSI (14) is currently moving below the 75-level, this could give the bears another chance to push the coin out of the overbought region. Meanwhile, any bullish movement above the upper boundary of the channel may likely hit the resistance levels at 2200 SAT and above.
Join Our Telegram channel to stay up to date on breaking news coverage