Join Our Telegram channel to stay up to date on breaking news coverage
XRP Price Prediction – April 2
XRP/USD is rising with a gain of 3.88% over the past 24 hours as it rises above the $0.60 level.
XRP/USD Market
Key Levels:
Resistance levels: $0.65, $0.67, $0.69
Support levels: $0.50, $0.48, $0.46
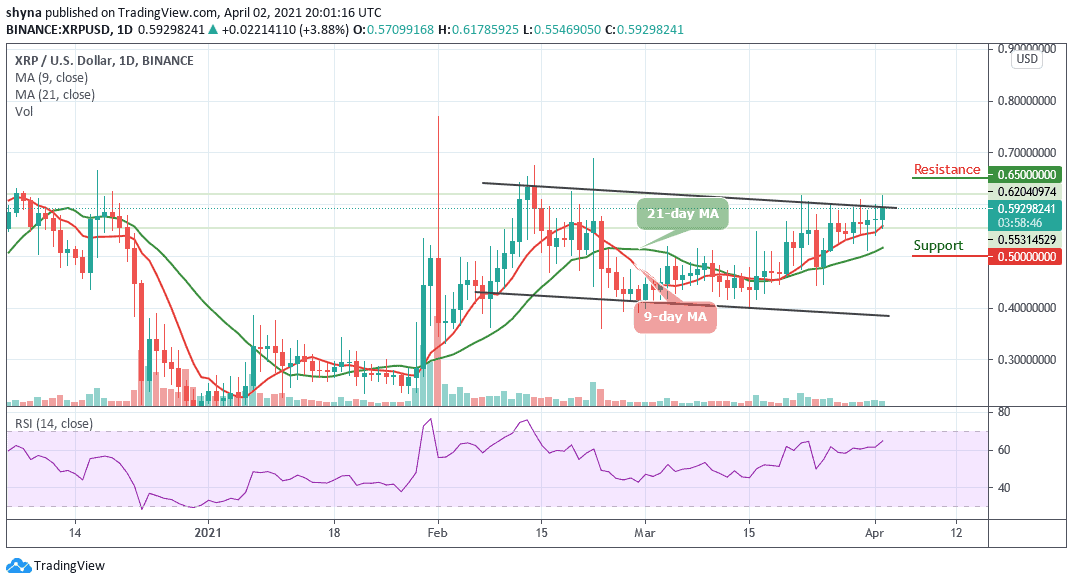
XRP/USD continues to hold strong above $0.55 and this level has been supporting the market since a few days ago. However, it’s possible that the more the resistance level of $0.60 is tested, the more it’s likely to break above. On the other hand, if XRP crosses below the 9-day and 21-day moving averages, we can expect the price to break beneath and the potential support levels of $0.50, $0.48, and $0.46 may be tested.
What is the Next Direction for Ripple?
At the time of writing, the price is hovering at $0.59 with the slightly bullish momentum supported by the 9-day moving average. The resistance levels to watch are $0.65, $0.67, and $0.69. The technical indicator is beginning to move gradually upwards. However, the bulls may remain in control until a larger divergence to the upside is seen.
Comparing with Bitcoin, the Ripple (XRP) has been slowly grinding higher. After bottoming out around the 949 SAT level, the price began to slowly ascend and is currently trading around the 1011 SAT. XRP’s price is now contained within the descending channel as traders wait for the bulls to hopefully push the price above the 9-day and 21-day moving averages.
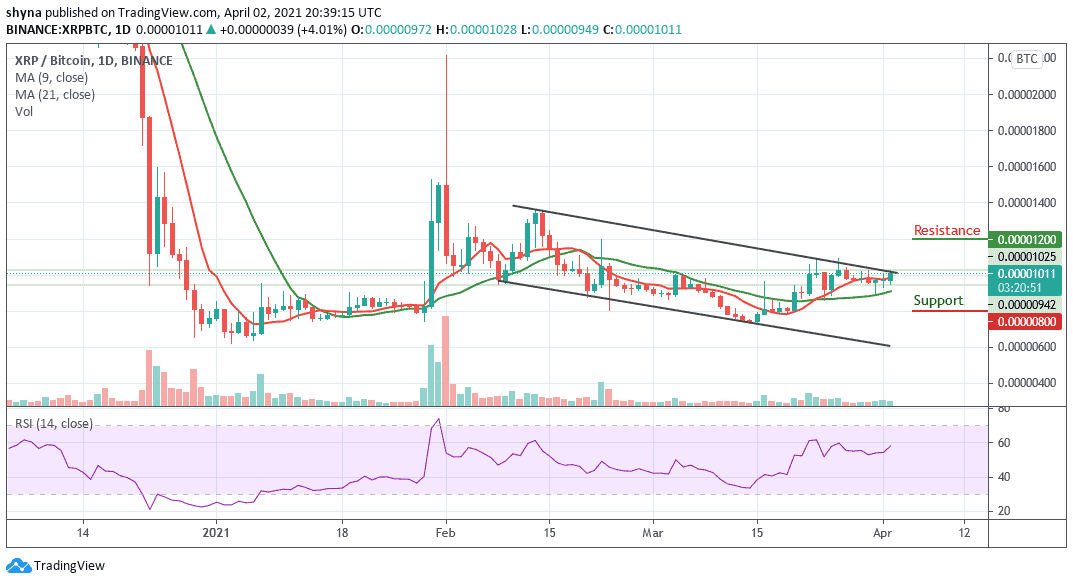
Moreover, if the bulls can break above the upper boundary of the channel, we can expect initial resistance at 1050 SAT. Above this, higher resistance lies at 1200 SAT and above. From below: If the sellers push the market beneath the moving averages, we can expect supports at 800 SAT and below. The RSI (14) is moving to cross above 60-level and it’s likely to follow a bullish movement.
Join Our Telegram channel to stay up to date on breaking news coverage