Join Our Telegram channel to stay up to date on breaking news coverage
Bitcoin (BTC) Price Prediction – April 2
BTC/USD continues trading sideways currently at $59,200 after another significant rejection from $60,055.
BTC/USD Long-term Trend: Bullish (Daily Chart)
Key levels:
Resistance Levels: $64,000, $66,000, $68,000
Support Levels: $55,000, $53,000, $51,000

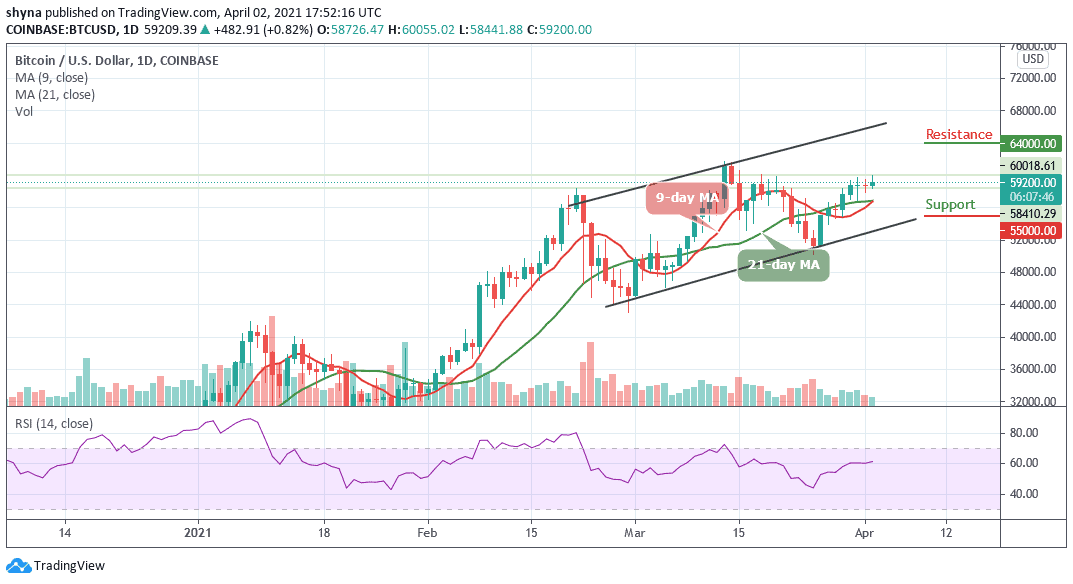
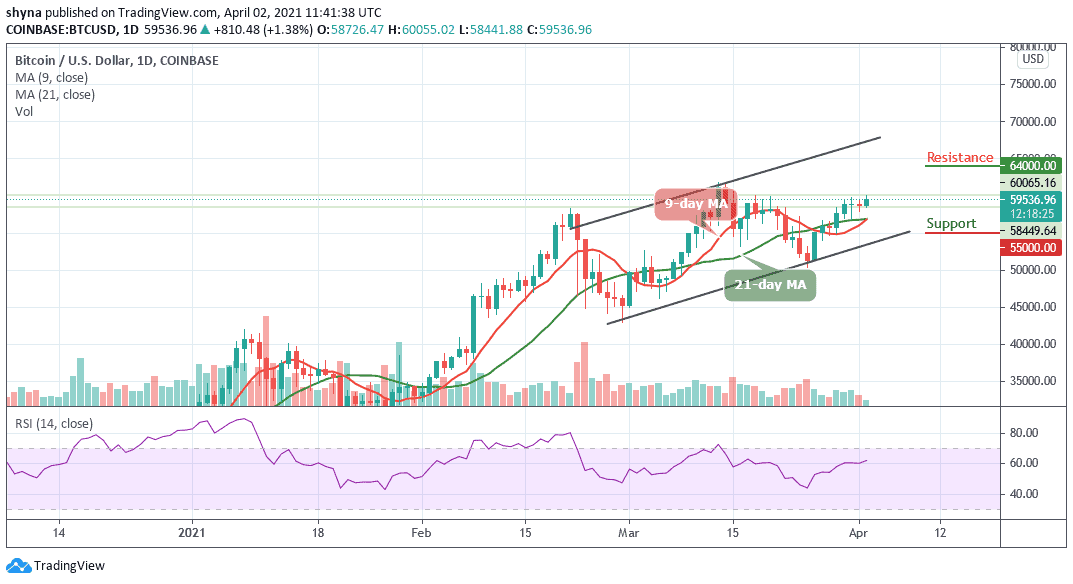
Looking at the daily chart, after seven consecutive bullish days, BTC/USD is still flat and trading sideways but has seen a volatile move, peaking at around $60,055 before quickly dropping to $58,441.88 above the 9-day and 21-day moving averages. Therefore, one can say that the Bitcoin (BTC) price is recovering and continues to trade sideways above the moving averages.
What is the Next Direction for Bitcoin?
According to the daily chart, BTC/USD is trading at $59,200 and displays an intraday gain of 0.82%. However, the prevailing trend is ranging from expanding volatility as the first digital asset continues to consolidate in a bullish flag pattern. Meanwhile, a breakout out from this pattern is supposed to continue in the direction of the previous trend. In this case, traders expect BTC/USD to rise above $60,000 resistance before moving towards the potential resistance levels at $64,000, $66,000, and $68,000.
Furthermore, should Bitcoin price failed to remain above the moving averages; the price could drop below this barrier and may head towards the $57,000 vital support. A further low drive could send the price to $55,000, $53,000, and $51,000 support. The technical indicator RSI (14) is seen moving sideways, which makes the market to be indecisive at the moment.
BTC/USD Medium – Term Trend: Ranging (1H Chart)
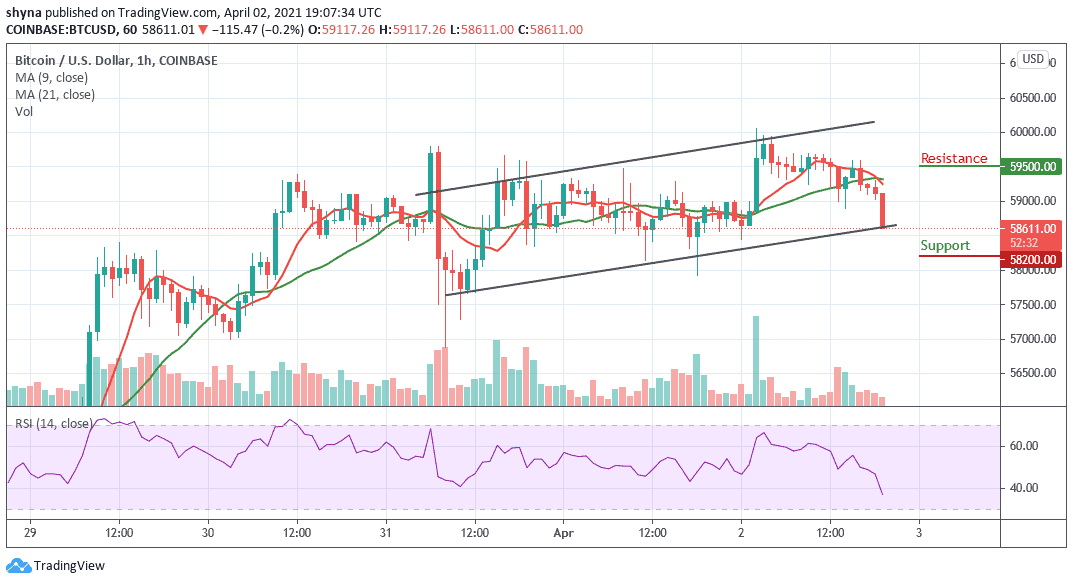
On the 1-hour chart, we can see that the bears are now stepping back into the market, trading below the 9-day and 21-day moving averages. Meanwhile, the $58,200 and below may be visited if BTC/USD breaks below the lower boundary of the channel.

However, if the buyers can push the market to the north, we may expect a retest at the $59,000 resistance level. Breaking the mentioned resistance may further allow the bulls to test the $59,500 and above on the upside but the technical indicator RSI (14) is moving towards the 40-level, indicating some bearish signals.
Join Our Telegram channel to stay up to date on breaking news coverage

