Join Our Telegram channel to stay up to date on breaking news coverage
Bitcoin (BTC) Price Prediction – April 2
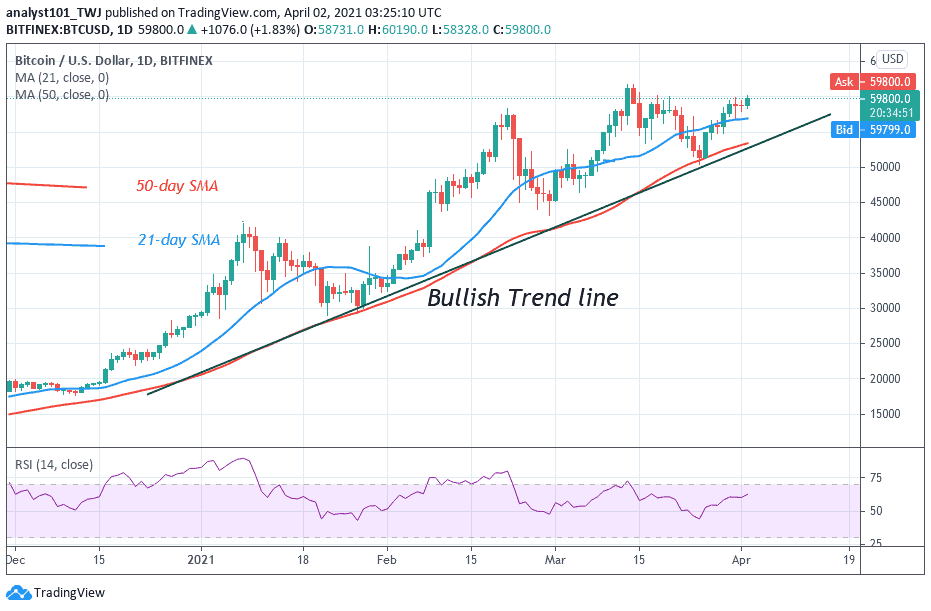
Bitcoin bulls are working hard to nurture a bullish trend from the support at $58,000.
BTC/USD Long-term Trend: Bullish (Daily Chart)
Key levels:
Resistance Levels: $64,000, $66,000, $68,200
Support Levels: $55,000, $53,000, $51,000
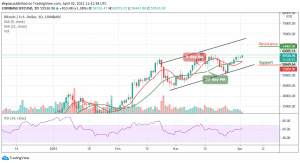
Bitcoin is currently trading 1.38% higher on the day. BTC/USD opened the session at $58,726 and touches the daily high of $59,536. The first digital coin is moving within the short-term bullish trend amid low volatility. The current conditions imply that the price may stay range-bound during the next trading hours as the coin remains above the 9-day and 21-day moving averages. Meanwhile, the technical indicator RSI (14) may start moving sideways.
What to Expect from Bitcoin (BTC)
At the opening of the market today, after testing the low of $58,441, BTC/USD is currently trading at $59,536. Meanwhile, looking at the market movement, there is likely that the market may experience a quick retracement or sell-off just after touching the crucial $60,000, and traders may see $59,000 to $59,500 being tested again before pushing higher.
On the downside, if the market decides to fall, the price of Bitcoin could fall below the moving averages at $55,700, and if that support fails to hold the sell-off, traders could see a further decline below the lower boundary of the channel and towards the support levels of $55,000, $53,000, and critically $51,000. All the same, any further bullish movement towards the upper boundary of the channel may hit the resistances at $64,000, $66,000, and $68,000.
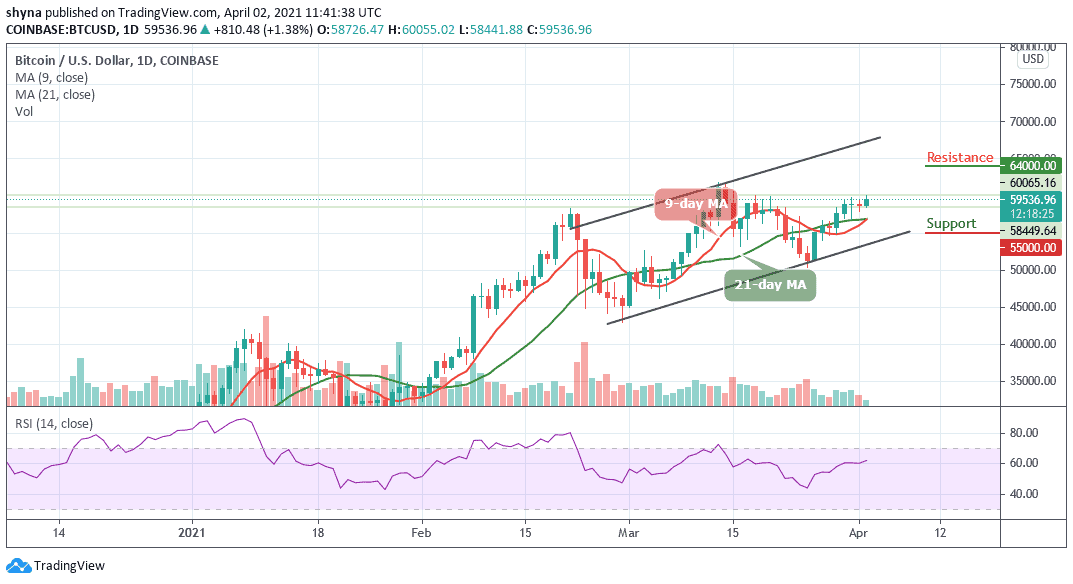
BTC/USD Medium – Term Trend: Ranging (4H Chart)
According to the 4-hour chart, the Bitcoin price first went up but now dropping slightly. If the price continues to drop further and move below the 9-day and 21-day moving averages, it could reach the nearest support levels at $57,000, $55,000, and $53,000 respectively.
Moreover, if the bulls push the coin above the 9-day and 21-day moving averages, the price of Bitcoin may likely reach the potential resistance levels of $62,000, $64,000, and $66,000. Presently, the market is indecisive as the RSI (14) indicator moves below the 60-level.
Join Our Telegram channel to stay up to date on breaking news coverage