Join Our Telegram channel to stay up to date on breaking news coverage
XRP Price Prediction – February 24
XRP/USD dropped a bit from $0.51 to $0.44 and this was after the coin touched the daily high of $0.51 Resistance level.
XRP/USD Market
Key Levels:
Resistance levels: $0.65, $0.70, $0.75
Support levels: $0.30, $0.25, $0.20
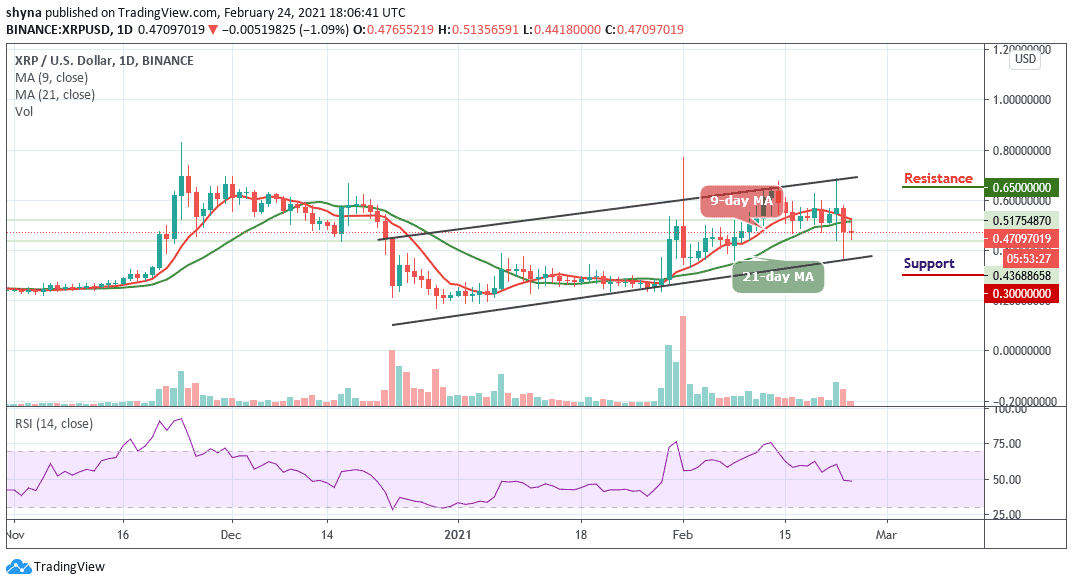
Having slides beneath the $0.50, XRP/USD may continue to show weakness in price and fall at support until the market can find a stable level to reinforce the bullish run. For now, a new low is yet to be ascertained as the bears remain dominant and active over the past days. Meanwhile, traders may need to wait for the bears to exhaust momentum before entering the market.
What is the Next Direction for Ripple?
According to the daily chart, if the market resumes sell-off now, the Ripple (XRP) may cross below the lower boundary of the channel and could find immediate support at $0.40 and $0.35 while the critical supports lie at $0.30, $0.25, and $0.20. However, XRP/USD pair has continued to erode bearishly on the daily time frame as the 9-day MA is trying to cross below the 21-day MA.
In other words, a bullish rally could confirm if the market can climb significantly back above the 9-day and 21-day moving averages. Meanwhile, the technical indicator RSI (14) continues to produce a bearish move below the 50-level. Therefore, if the Ripple (XRP) manages to surge above $0.50, the market price may likely reach the resistance levels at $0.65, $0.70, and $0.65.
When compares with Bitcoin, the pair is consolidating within the channel and now moving below the 9-day and 21-day moving averages. Meanwhile, the buyers are making effort to push the coin to the north so that the bullish continuation may take it to the resistance levels of 1500 SAT and above respectively.
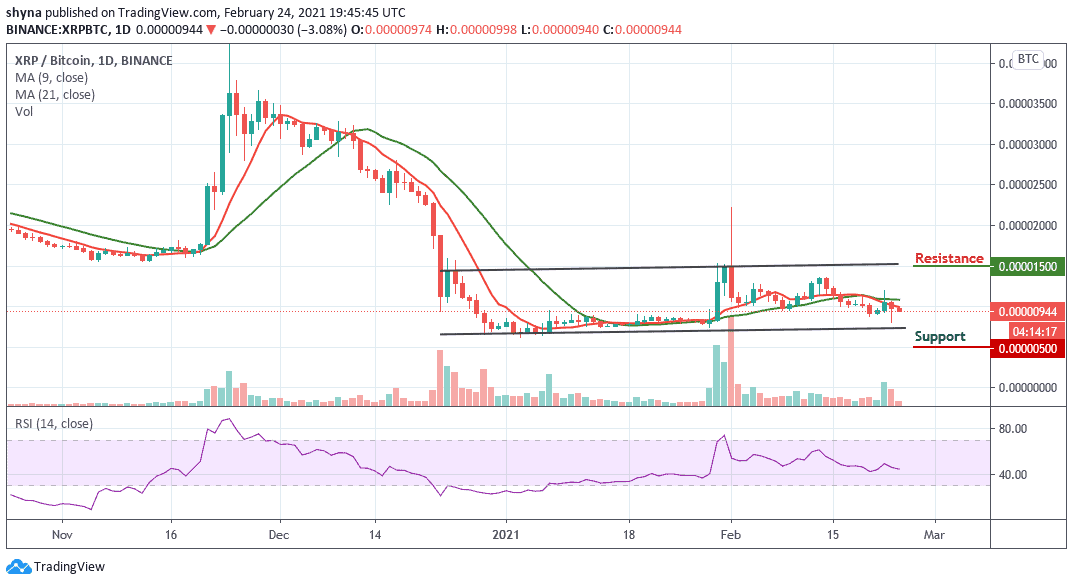
On the other hand, as the coin continues to drop towards the lower boundary of the channel, it may likely reach the nearest support level of 500 SAT and below. Moreover, the technical indicator RSI (14) moves around 45-level, suggesting more sideways movement.
Join Our Telegram channel to stay up to date on breaking news coverage