Join Our Telegram channel to stay up to date on breaking news coverage
XRP Price Prediction – February 16
XRP/USD is seen trading below the moving averages as the technical indicator RSI (14) moves below the 65-level.
XRP/USD Market
Key Levels:
Resistance levels: $0.68, $0.70, $0.72
Support levels: $0.44, $0.42, $0.40
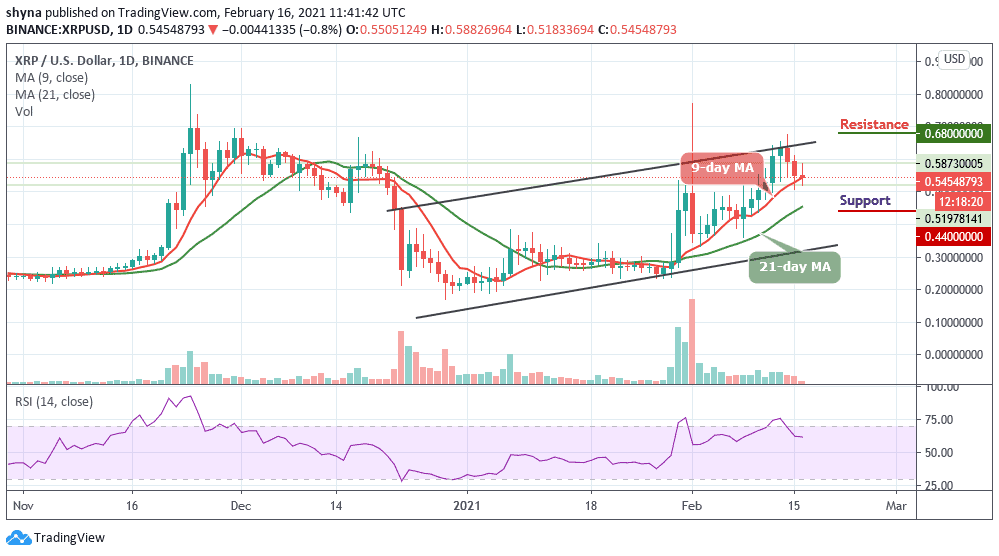
XRP/USD is following the downward movement as it is slowly declining below the key supports. The coin might revisit the $0.50 support before it could start a new increase. However, a couple of days ago, after struggling to stay above the upper boundary of the channel, Ripple (XRP) started a slow and steady decline as the coin is now trading below the 9-day moving average to move into a short term bearish zone.
Where is the Ripple Price Going Next?
The pair is currently exchanging hands at $0.545 and any attempt to make it cross below the 21-day moving average may likely open the doors for more downsides and the price could spike below the $0.48 support level. However, traders should keep an eye on the $0.60 before creating a new bullish trend at the resistance levels of $0.68, $0.70, and $0.72.
More so, traders may experience a quick buy once the trade reaches the support at $0.50. And if the price fails to rebound, then a bearish breakout is likely to trigger more selling opportunities for traders, which might cause the price to retest $0.44 and could further drop to $0.42, and $0.40 support levels as the RSI (14) crosses below the 65-level.
When compares with BTC, the Ripple (XRP) is moving sideways within the channel. Meanwhile, if the selling pressure persists, the Ripple price variation may likely bring a new low into the market. At the moment, the technical indicator RSI (14) is moving below 60-level; more negative moves may come to play in the market as the pair moves under the 9-day and 21-day moving averages.
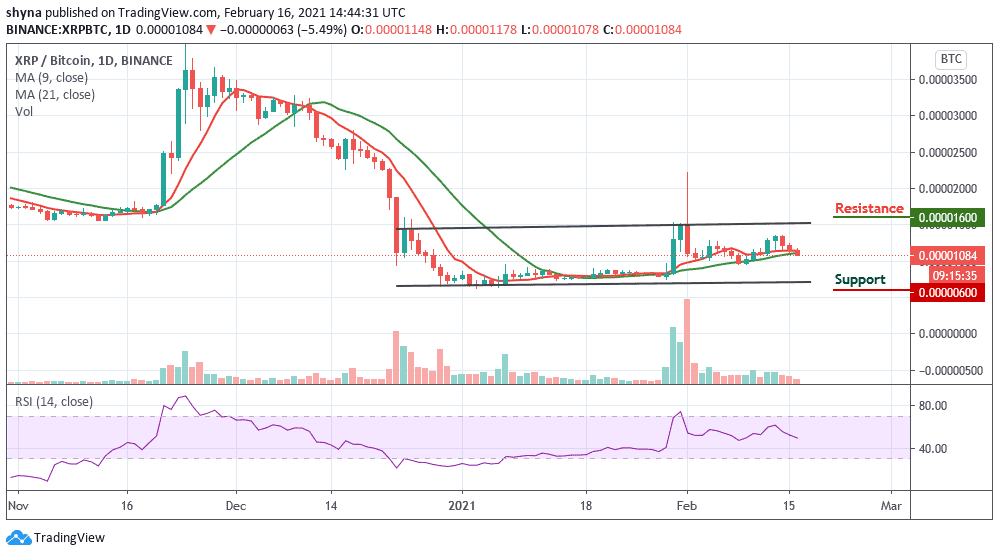
In addition, traders may expect close support below the moving averages at the 770 SAT before breaking to 600 SAT and below. However, should a bullish movement occurs and pushes the coin above the upper boundary of the channel; traders can then confirm a bull-run for the market and the nearest resistance levels lie at 1600 SAT and above.
Join Our Telegram channel to stay up to date on breaking news coverage