Join Our Telegram channel to stay up to date on breaking news coverage
XRP Price Prediction – February 9
The Ripple (XRP) renews the bullish trend after testing the support level of $0.36 yesterday.
XRP/USD Market
Key Levels:
Resistance levels: $0.62, $0.64, $0.66
Support levels: $0.31, $0.29, $0.27
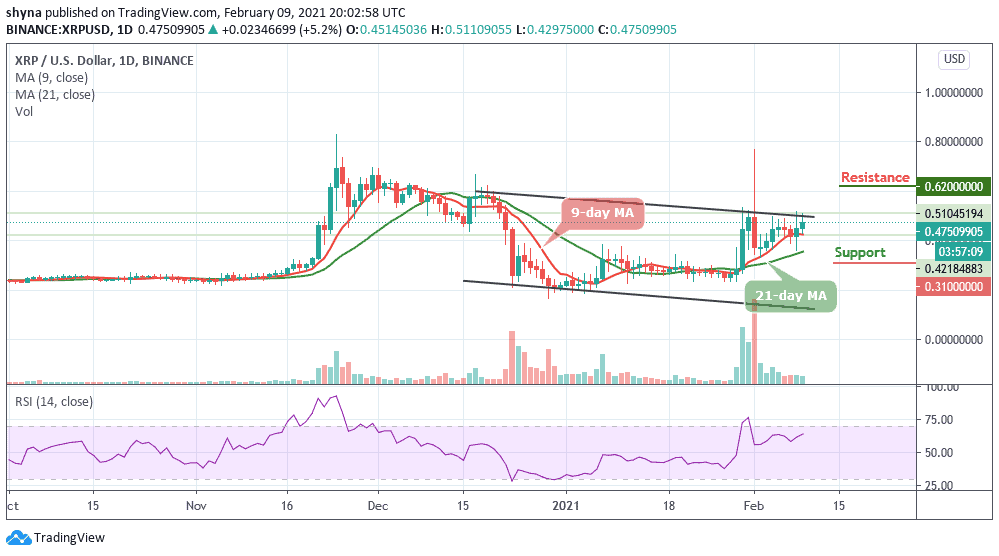
XRP/USD is currently trading above the 9-day and 21-day moving averages. The fourth-largest cryptocurrency by market capitalization has on several occasions been able to remain above the $0.40 resistance level. A monthly high traded at $0.77 marked the end of the bullish action towards $0.80 and paved the way for losses under $0.40.
What is the Next Direction for Ripple?
XRP/USD commences an intriguing recovery towards a $0.50 resistance level. The initial break above the 9-day moving average boosted the price farther up. The Ripple (XRP) hit a daily high of $0.51 before retreating back to where it is currently trading. Meanwhile, from above, more hurdles may come into play above the upper boundary of the channel and of course, the nearest resistance level is located at $0.55.
However, the short-term trend remains in the hands of the bulls supported by the technical indicator where the RSI (14) is almost crossing above 62-level, building on the consistent recovery from the downside recorded on February 1. Ripple’s bullish scenario is emphasized by the RSI (14) indicator as it extends the action above the 60-level.
Nevertheless, a break above $0.62 and $0.64 resistance levels may most likely push the coin above the potential $0.66 resistance level while a break below the moving averages may lead to the supports at $0.31, $0.29, and $0.27 respectively.
Against Bitcoin, the pair is consolidating to the downside and moving within the 9-day and 21-day moving averages. Meanwhile, the bulls have been trying to push the price above the moving averages; breaking above the channel may likely take it to the resistance levels of 1500 SAT and above.
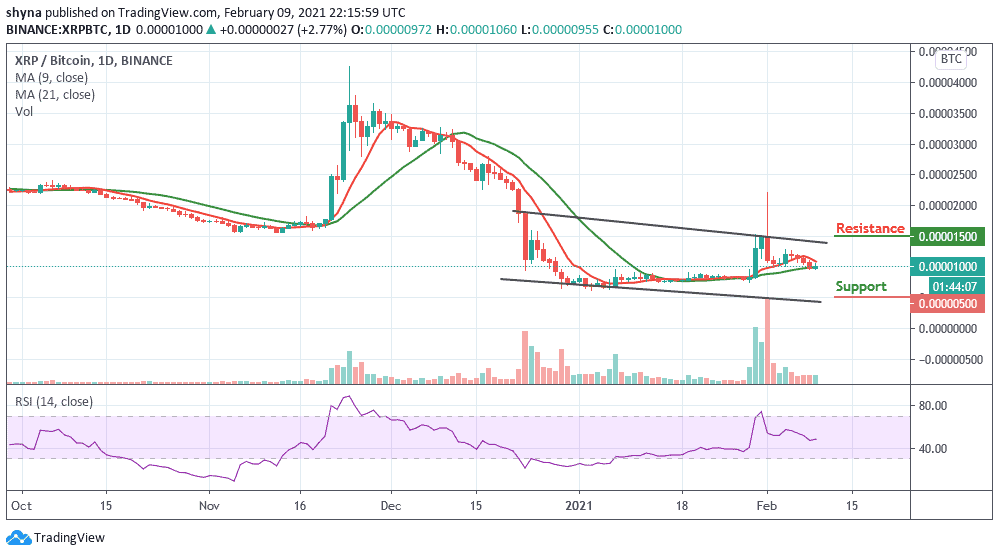
In other words, if the coin decides to follow the downtrend, then it may likely hit the critical support at 500 SAT and below. Meanwhile, the technical indicator RSI (14) is moving above 45-level, suggesting additional bullish signals.
Join Our Telegram channel to stay up to date on breaking news coverage