Join Our Telegram channel to stay up to date on breaking news coverage
ETH Price Prediction – February 9
ETH/USD is trading at the upside as the coin is technically and fundamentally trading above the moving averages.
ETH/USD Market
Key Levels:
Resistance levels: $2000, $2100, $2200
Support levels: $1400, $1300, $1200
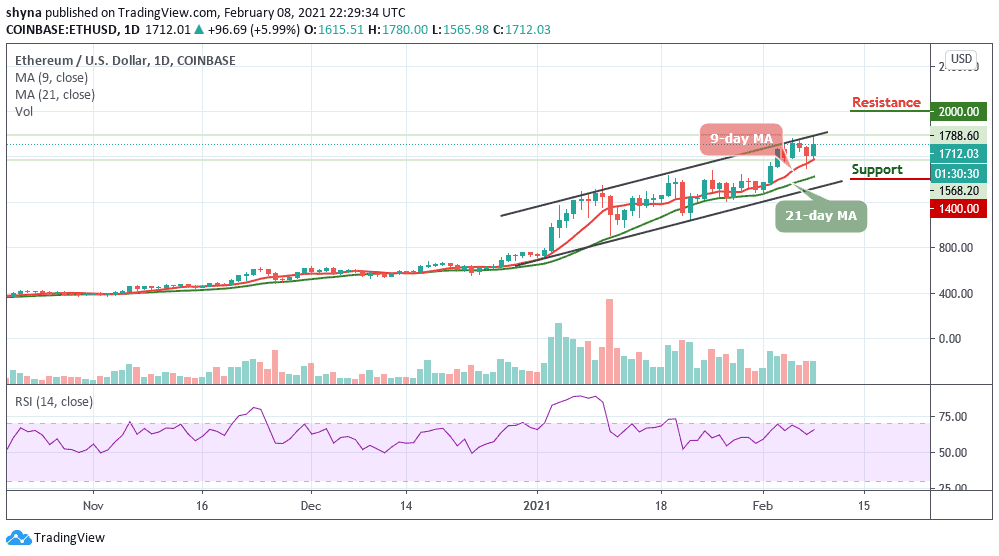
As reveals by the daily chart, ETH/USD is currently trading above the 9-day and 21-day moving averages within the ascending channel. The second-largest cryptocurrency has quietly scored another all-time high as the coin soar above the $1,800 level to touch the daily high of $1824 but now trading at $1,761. Meanwhile, the break above the $1800 resistance is the first signal needed for a bullish to press higher. Nevertheless, ETH/USD has to break above the upper boundary of the channel before hitting the important resistance at $1900.
What to Expect from Ethereum (ETH)
Looking at the daily chart, if the buyers continue to grind higher, the first level of resistance may be located at $1800 and above. However, additional resistance may also be found at $2000, $2100, and $2200 respectively. On the other side, if the market price moves below the 9-day and 21-day moving averages, the first level of support lies below the lower boundary of the channel.
However, crossing below this barrier may lead to the critical support levels at $1400, $1300, and $1200. The technical indicator RSI (14) remains calm below the 70-level, which indicates the market is attempting to follow a sideways movement and this, could also mean that another opportunity to get ready for additional uptrends.
Against Bitcoin, the daily chart shows that Ethereum’s price is trading below the 9-day and 21-day moving averages around the 3698 SAT. As soon as the price crosses above the moving averages, there is a possibility that additional benefits may be obtained in the long term. The next resistance key above this level is close to the 4300 SAT level. If the price keeps rising, it could even break the 4400 SAT and above in future sessions.
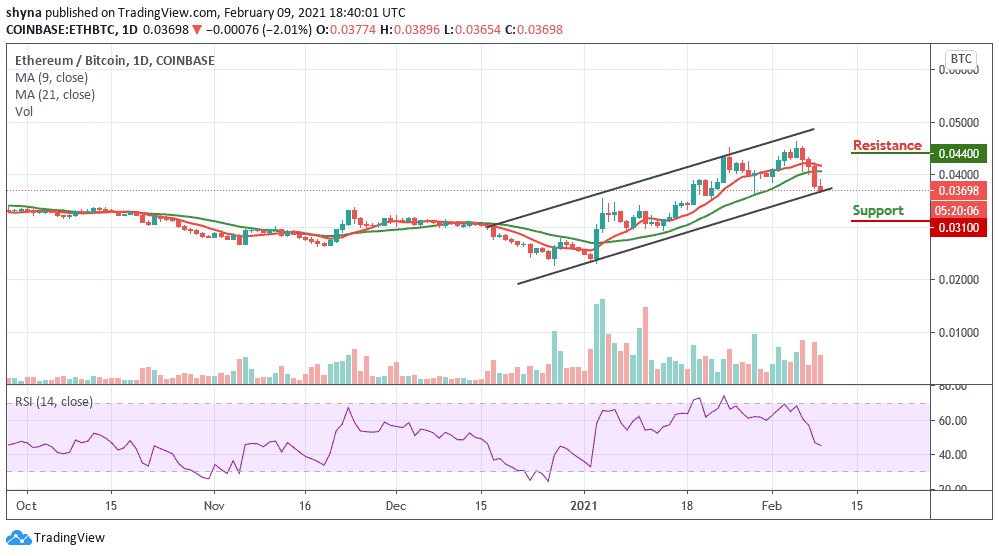
However, if the bears continue to push the price below the lower boundary of the channel, 3600 SAT and 3400 SAT supports may play out before rolling to the critical support at 3100 SAT and below. The RSI (14) is moving below the 50-level, suggesting more bearish signals.
Join Our Telegram channel to stay up to date on breaking news coverage