Join Our Telegram channel to stay up to date on breaking news coverage
XRP Price Prediction – February 6
XRP/USD bulls have been trying to break above the upper boundary of the channel but the price has been rejected.
XRP/USD Market
Key Levels:
Resistance levels: $0.60, $0.65, $0.70
Support levels: $0.25, $0.20, $0.15
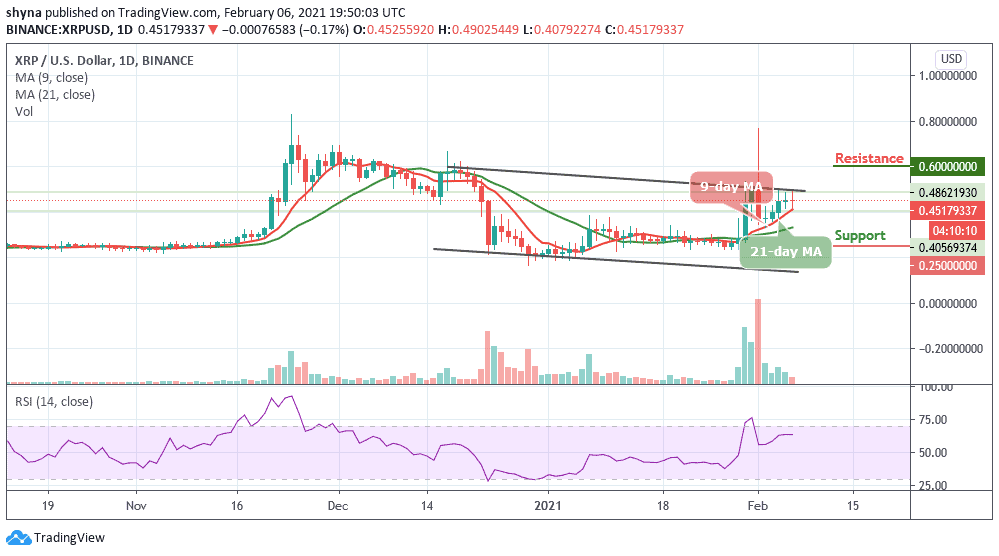
The daily chart reveals that XRP/USD is following a sideways movement at the time of writing. The 21-day moving average is now acting as support even though the price has not been able to climb below it several times. However, should in case the bulls want to see a shift in momentum, they will need to hold the price above the moving averages.
Where is Ripple Price Going Next?
Ripple (XRP) is currently trading at $0.45 and any attempt below the 9-day and 21-day moving averages could open the door to drop further and the price could fall below the $0.35 support level. However, the traders need to keep an eye on the $0.50 before moving upwards while the resistance levels lie at $0.60, $0.65, and $0.70.
In addition, the market may experience a quick-buy as soon as the market price moves above the upper boundary of the channel. And if the price fails to rebound, then a bearish breakout is likely to trigger more selling opportunities for traders, which might cause the price to retest $0.35, which could further drop to $0.25, $0.20, and $0.15 support levels respectively. The RSI (14) is likely to move to the downside as the signal line moves below 65-levels.
Against Bitcoin, the situation is becoming bleak as the market trades below the 9-day moving average. The XRP/BTC has not been able to break above the channel. The market opens today with a downtrend where it touches the daily low of 1067 SAT.
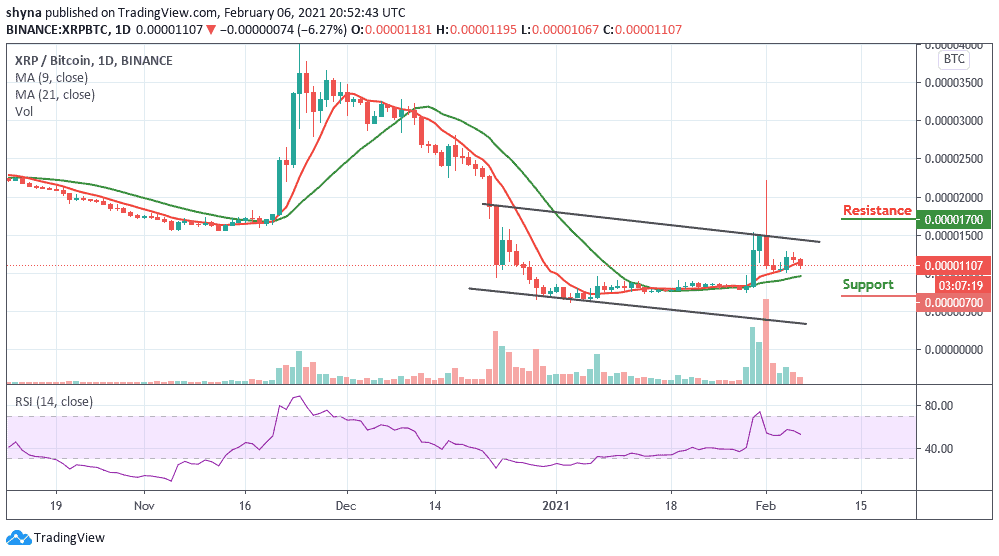
However, looking at the daily chart, the bears may be stepping back into the market and could bring the price back below the moving averages at the nearest support level of 700 SAT and below. In addition, the technical indicator RSI (14) may remain at the downside as the signal line moves below 55-level, which indicates that the bearish movement may continue to play out.
Join Our Telegram channel to stay up to date on breaking news coverage