Join Our Telegram channel to stay up to date on breaking news coverage
Bitcoin (BTC) Price Prediction – February 6
The Bitcoin (BTC) keeps showing signs of kick-starting a fresh rally towards its previous peak at $42,000.
BTC/USD Long-term Trend: Bullish (Daily Chart)
Key levels:
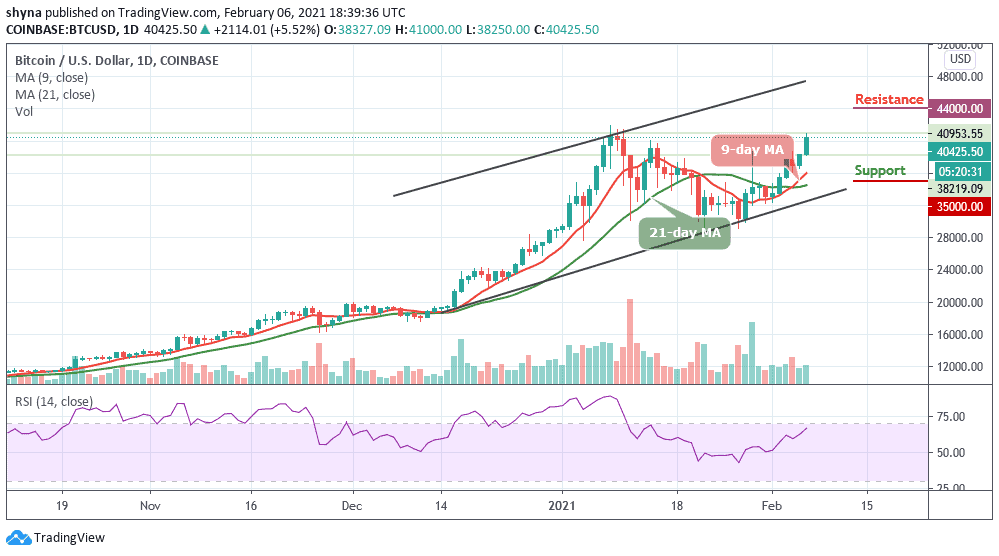
Resistance Levels: $44,000, $46,000, $48,000
Support Levels: $35,000, $33,000, $31,000

Today’s positive price action has seen BTC/USD bulls surmount $40,000, which is one of the biggest hurdles on the way towards a new all-time high. At the time of writing, BTC/USD is up nearly 5.52% to trade at the $40,425 resistance level. However, traders may now be hoping that the Bitcoin bulls can sustain the current momentum and keep the market price above the $38,000 and $40,000 levels in the foreseeable future.
What is the Next Direction for Bitcoin?
The Bitcoin (BTC) is now back in a positive zone, and this time around, the king coin is fast-moving above $40,000 amid a less overheated derivatives market. Meanwhile, the digital asset technically started breaking out of the bull flag two days ago when it surmounted the major hurdle at $38,000 for the first time in weeks.
More so, the king coin is looking stronger than the last time it breached $40,000 and the price may likely stabilize above this level due to the calmer market sentiment and less crowded BTC futures market prevailing at the moment. In addition, as the RSI (14) is soaring towards the 70-level, BTC/USD may soon hit the potential resistance levels at $44,000, $46,000, and $48,000 while sliding below the moving averages could drag the price to the critical support levels of $35,000, $33,000, and $31,000 respectively.
BTC/USD Medium-term Trend: Bullish (4H Chart)
Looking at the 4-hour chart, BTC/USD is seen retreating after touching the daily high at $41,000. Today’s price move happens to be the most impressive one as it keeps climbing above the moving averages with a sharp surge. However, BTC/USD is now maintaining its bull-run above $40,000 as the RSI (14) moves within the overbought region.

In other words, BTC/USD may likely take a downward as the technical indicator RSI (14) nosedives towards the 70-level. However, the coin could breach the nearest support at $39,000 to reach the support level of$38,000 and below. More so, if bulls find a decent support around $41,000, the bulls may continue its uptrend by crossing above the channel to hit another resistance at $43,000 and above.
Join Our Telegram channel to stay up to date on breaking news coverage

