Join Our Telegram channel to stay up to date on breaking news coverage
ETH Price Prediction – February 4
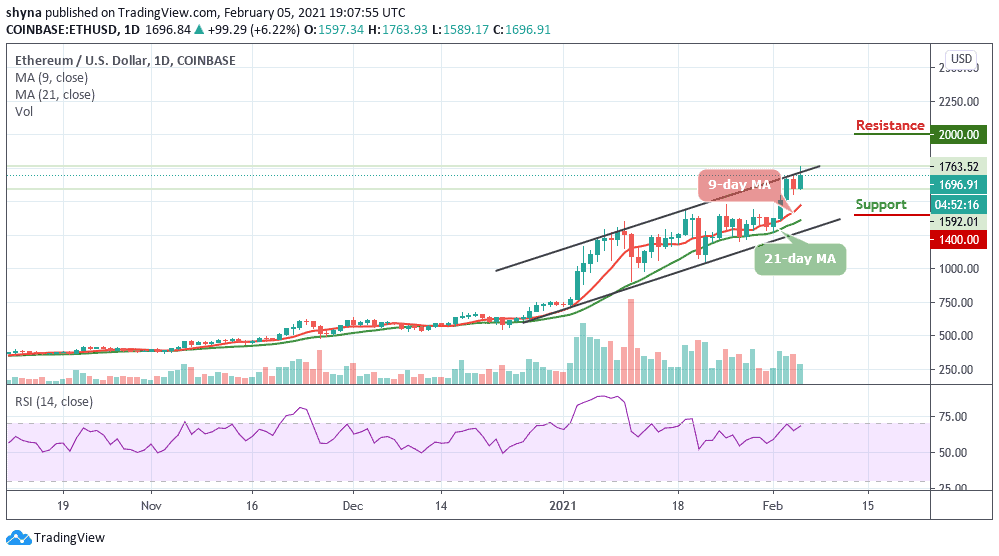
According to the daily chart, Ethereum (ETH) breaks out as the price hits the daily high at $1,763.
ETH/USD Market
Key Levels:
Resistance levels: $2000, $2100, $2200
Support levels: $1400, $1300, $1200

ETH/USD keeps seeing an increased interest which is helping the coin to skyrocket the price above the resistance level of $1,763. However, at the time of writing, Ethereum (ETH) is trading hovering at $1,696 after hitting a high of $1,763 today. Meanwhile, Ethereum (ETH) remains the second-largest cryptocurrency by market capitalization, with today’s price surge driving market capitalization to new heights as well. It now sits at roughly $186.9 billion.
What to Expect from Ethereum (ETH)
The Ethereum price is currently rising above the $1500 level as it is settling above the 9-day and 21-day moving averages. However, due to a strong upside movement of the coin, ETH/USD may soon reach the resistance level of $1800. Looking at the daily chart, the $1500 remains to be a key support zone and if it is broken, the sell-off may be extended towards the $1450 support level.
Currently, bulls are making effort to push the coin above the upper boundary of the channel. In other words, any reversal to the south may likely welcome the resumption of the bears back into the market and the price could meet the critical supports at $1400, $1300, and $1200 levels.
More so, the RSI (14) moves to cross above the 70-level, which indicates the continuation of the bullish trends and further resistance could be found at $2000, $2100, and $2200 levels.
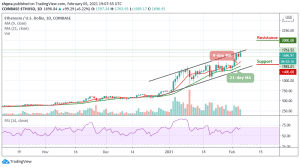
When compares with Bitcoin, the coin remains within the ascending channel. The price is forming a bullish trend on the chart and it is above the 9-day and 21-day moving averages. The bulls are still pushing the price upward and if they continue to maintain the trends, the price may likely hit the resistance level at 0.050 BTC and above.
Moreover, Ethereum has been trending within the channel bullishly but any retracement could bring the price to the nearest support level and this may reach the major support level of 0.040 BTC and below. Surprisingly, the technical indicator RSI (14) is seen moving into the overbought region, suggesting more bullish signals in the nearest term.
Join Our Telegram channel to stay up to date on breaking news coverage